Rapid Ext JS (beta)


Embedding and Interacting with Tableau Visualizations Inside Your Ext JS Apps
January 25, 2017
107 Views
If you’re looking to build your next web application with all the goodness of Tableau and a rich user interface to drive actions, then this article is for you. By embedding Tableau inside Sencha Ext JS applications, you can deliver the best BI Analytics experience to your users and offer seamless interaction with two-way data exchange.
Ext JS component APIs make it super easy to embed Tableau visualizations and exchange data to and from Tableau. The Ext JS component lifecycle hooks ensure that the Tableau visualizations are an integral part of your web application and interact seamlessly with your application workflow. And, with strong data APIs in place, you can do all the data translation or transformation needed to structure the Tableau data into the format that is most suitable for the application.
In this article, we’ll demonstrate how to build an Ext JS application with embedded Tableau visualizations and link them with your application logic. You’ll learn how to:
- Apply filters to Tableau visualizations embedded within Ext JS applications
- Read Tableau’s native filters and drive application behavior
- Read Tableau’s visual data selections (e.g. a bar in a Tableau visualization) and use it to drive application behavior
Overview
In this article, we’ll be creating an Ext JS application containing a Tableau visual and a Sencha Pie Chart, as shown below:
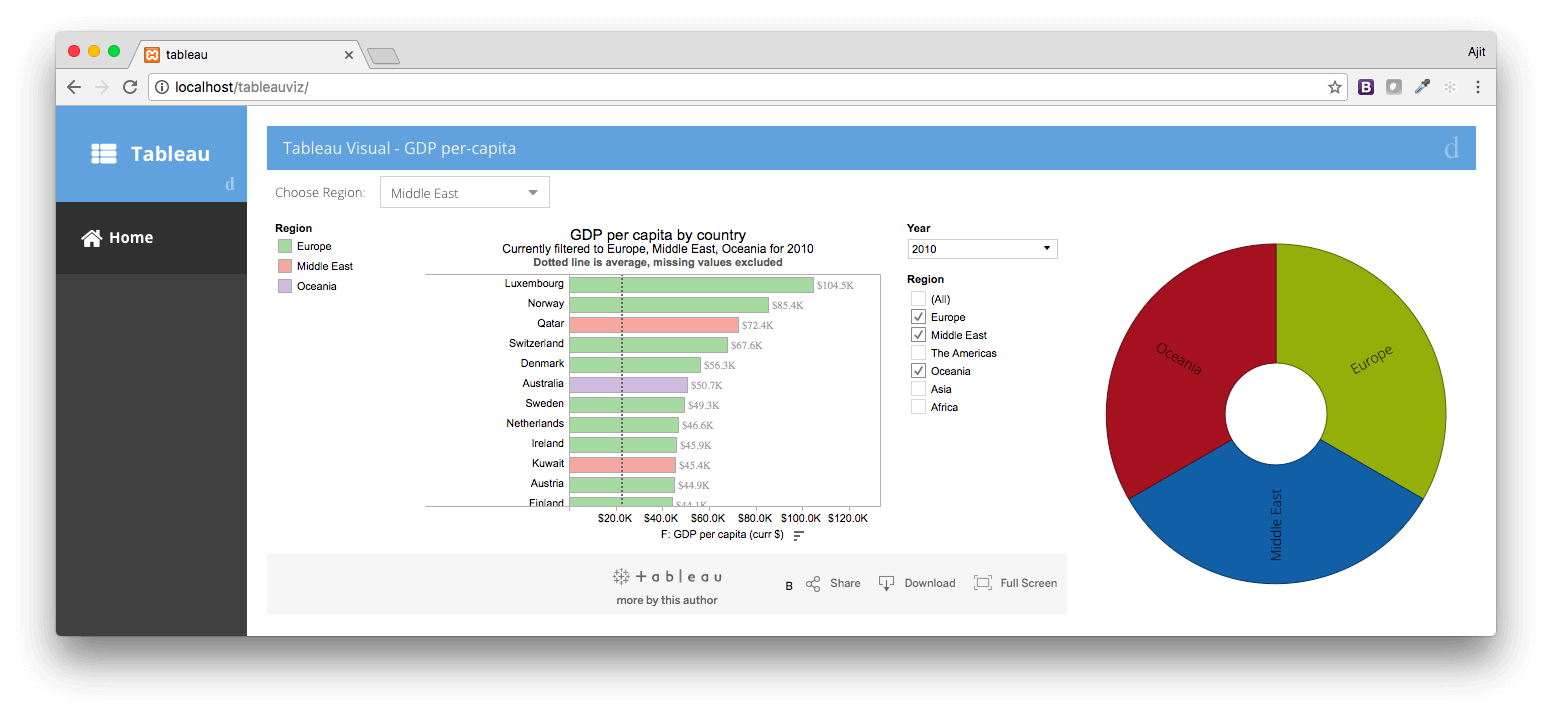
We’ll be initializing the Tableau visual based on the Choose Region combo-box selection. Pies in the Pie chart will be rendered based on the regions selected inside the Tableau visual. We’ll also handle the event when a particular bar/mark is selected on the Tableau visual.
Getting Started
Before we begin, there are few things that you’ll need:
- Cmd 6.2+
- Ext JS 6.2+
- Tableau JS library – Required to render and work with Tableau visuals inside a JavaScript application, like Ext JS
- Tableau public visuals – Publicly available Tableau visuals that can be used inside an application
- Tableau JS API reference – JS API reference for processing filters and marks
The publicly available Tableau visuals can be opened directly in a browser. To find the Tableau visual URL that can be used in an Ext JS application, click on the Share button at the bottom of every visual and copy the Link field value, as shown in the image below:
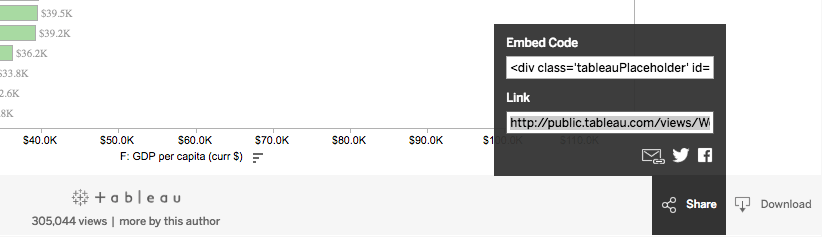
In this article, we’ll be using the following visual:
http://public.tableau.com/views/WorldIndicators/GDPpercapita
Now, that we’ve identified the Tableau visual, we’ll start with creating an Ext JS project.
Creating the Application
Create an Ext JS application by running the following command inside a folder of your choice:
sencha -sdk /path/to/sdk generate app -ext -classic tableau tableau-extjs
This command generates a sample application inside the tableau-extjs folder with tableau as the application name.
Next, go inside the tableau-extjs folder and run the following command, which starts a web server to access the application and also starts watching for changes being made to the project:
sencha app watch
Access http://localhost:1841/ URL in a browser to see the generated sample application, as shown below:

We’ll now make changes to this app to replace the Personnel grid with a Tableau visual and other components that we need for the application.
Adding a Tableau Visual to an Ext JS Application
Edit index.html and add Tableau JS library:
Next, add charts package to app.json:
    "requires": [
        "font-awesome",
        "charts"
    ],
Now, add the following Tableau component class to view/main/tableau folder:
Ext.define('tableau.view.tableau.Tableau', {
    extend: 'Ext.Component',

    xtype: 'tableauviz',

    viz: null,
    workbook: null,
    activeSheet: null,

    config: {
        regionFilterTxt: '',
        vizUrl: '',
        options: {
            hideTabs: true,
            hideToolbar: true
        }
    },

    onBoxReady: function(width, height) {
        this.setOptions(Ext.apply({
            width: width,
            height: height
        }, this.getOptions()));
    },

    onResize: function(width, height) {
        if (this.activeSheet) {
            this.viz.setFrameSize(width, height);
        }
    },

    afterRender: function() {
        var me = this;

        me.callParent();

        var placeholderDiv = me.getEl().dom;
        var url = this.getVizUrl();

        var options = Ext.apply({
            onFirstInteractive: function () {
                me.workbook = me.viz.getWorkbook();
                me.activeSheet = me.workbook.getActiveSheet();
            }
        }, this.getOptions());

        me.viz = new tableauSoftware.Viz(placeholderDiv,
                  url, options);
    }
});
Next, add the following class to view/main folder:
Ext.define('tableau.view.main.TableauNExt', {
    extend: 'Ext.Panel',

    requires: ['Ext.chart.series.Pie',
              'tableau.view.tableau.Tableau'],

    xtype: 'tableaunext',

    title: 'Tableau Visual - GDP per-capita',

    items: [{
        xtype : 'toolbar',
        docked: 'top',
        items: [{
            xtype: 'combobox',
            fieldLabel: 'Choose Region',
            triggerAction: 'all',
            store : {
                fields: ['abbr', 'name'],
                data : [
                    {"abbr":"", "name":"All"},
                    {"abbr":"Europe", "name":"Europe"},
                    {"abbr":"Middle East", "name":"Middle East"},
                    {"abbr":"The Americas", "name":"The Americas"},
                    {"abbr":"Oceania", "name":"Oceania"},
                    {"abbr":"Asia", "name":"Asia"},
                    {"abbr":"Africa", "name":"Africa"}
                ]
            },
            value: 'All',
            queryMode: 'local',
            displayField: 'name',
            valueField: 'abbr'
        }]
    }, {
        xtype: 'container',
        layout: 'hbox',
        items: [{
            xtype: 'tableauviz',
            flex: 1,
            vizUrl: "http://public.tableausoftware.com/views/WorldIndicators/GDPpercapita"
        }, {
           xtype: 'polar',
           width: 400,
           height: 400,
           insetPadding: 10,
           innerPadding: 10,
           interactions: ['rotate', 'itemhighlight'],
           store: {
               fields: ['name', 'data1'],
               data: [{
                   name: 'Europe',
                   data1: 14
               }]
           },
           series: {
               type: 'pie',
               highlight: true,
               angleField: 'data1',
               label: {
                   field: 'name',
                   display: 'rotate'
               },
               donut: 30
           }
        }]
    }]
});
Now, edit Main.js and set the items to:
    items: [{
        title: 'Home',
        iconCls: 'fa-home',
        items: [{
            xtype: ‘tableaunext’
        }]
    }]
Then, add tableau.view.main.TableauNExt to the requires array of Main.js.
Now, run sencha app watch and access the application in the browser. You’ll see the following output:

The Choose Region selection has no effect and neither does the Region selection inside the Tableau visual.
Applying Filters to Tableau Visualization
Now, we can read the Choose Region combo-box selection and use that as a region filter to initialize the Tableau visual. To do this, we’ll:
Read the selected region when the combo-box selection changes.
Modify the afterRender method to register handler for change event on the combo-box, as shown below:
afterRender: function() {
    this.callParent();

    var cbx = this.down('combobox');
    cbx.on('change', this.filterSingleValue, this);
    …
Add the new handler method – filterSingleValue – to the tableau.view.main.TableauNExt class:
filterSingleValue: function(cmp, newVal) {
    this.down('tableauviz').setRegionFilterTxt(newVal);
},
The handler method calls the setter method regionFilterTxt config to set the region on the Tableau component. In Ext JS, to respond to the set operation on a config, we have to apply and update the version of the hook methods available. In this case, we’ll be using the update hook method to apply the region filter on the Tableau visual.
Now, add the following update method to the tableau.view.tableau.Tableau class:
updateRegionFilterTxt: function(newVal, oldVal) {
    if (this.activeSheet) {
        this.activeSheet.applyFilterAsync(
            "Region",
            newVal,
            (newVal !== "") ?tableauSoftware.FilterUpdateType.REPLACE : tableauSoftware.FilterUpdateType.ALL);
    }
}
The method checks newVal when it’s passed to it and applies it as a region filter if it’s not an empty string (i.e. All was selected). Otherwise, sets the ALL filter.
Next, add the following line of code to the onFirstInteractive method, so the combo-box selection is applied when the visual renders for the first time:
me.updateRegionFilterTxt(me.getRegionFilterTxt());
Save the changes and reload the application in the browser. You’ll see that the Tableau visual responds to the combo-box selection, as shown below:

Reading Tableau’s Native Filters
The Tableau viz class fires the filterchange event when a user changes the visual filters. The filter data is made available to the handler through the event object.
To register the filterchange handler, edit the tableau.view.tableau.Tableau class afterRender method and add the following code after the visualization has been instantiated:
me.viz.addEventListener('filterchange', function(e) {
    e.getFilterAsync().then(function(filter) {
        me.fireEvent('filterchanged', me, filter.getAppliedValues());

    });
});
The handler is firing a custom event and passing the filters array to the listener. We’ll handle this custom event in our application and do something interesting.
Next, handle the filterchanged event in the afterRender method of tableau.view.main.TableauNExt class:
var viz = this.down('tableauviz');
var me = this;

viz.on('filterchanged', function(cmp, vizFilters) {
    var store = me.down('polar').getStore();
    store.removeAll(true);

    var l = vizFilters.length;
    var recs = [];
    for (var i = 0; i < l; i++) {
        var name = vizFilters.value;

        recs.push({
            name: name,
            data1: 100/l
        });
    }
    store.add(recs);
});
The handler is reading all the applied filters and using them to prepare records for the Pie Chart, so the pie can be created for the applied regions.
Reload the application and you’ll see the Tableau visual filters drive the pie chart, as shown below:

Reading Tableau’s Visual Data Selections
Tableau fires the marksselection event when one or more marks on a visual have been selected.
Modify the afterRender method of the tableau.view.tableau.Tableau class to register the handler:
me.viz.addEventListener('marksselection', function(e) {
    e.getMarksAsync().then(function(marks) {
      var retData = [];
      for (var markIndex = 0; markIndex < marks.length; markIndex++) {
        var pairs = marks[markIndex].getPairs();

        retData[markIndex] = [];

        for (var pairIndex = 0; pairIndex < pairs.length; pairIndex++) {
          var pair = pairs[pairIndex];
          retData[markIndex].push({
            fieldName: pair.fieldName,
            formattedValue: pair.formattedValue});
        }
      }
      me.fireEvent('marksselected', me, retData);
    });
});
The handler prepares a two-dimensional array for the selected marks and passes it to the listener of the custom event – marksselected – which can be handled in the other part of the application.
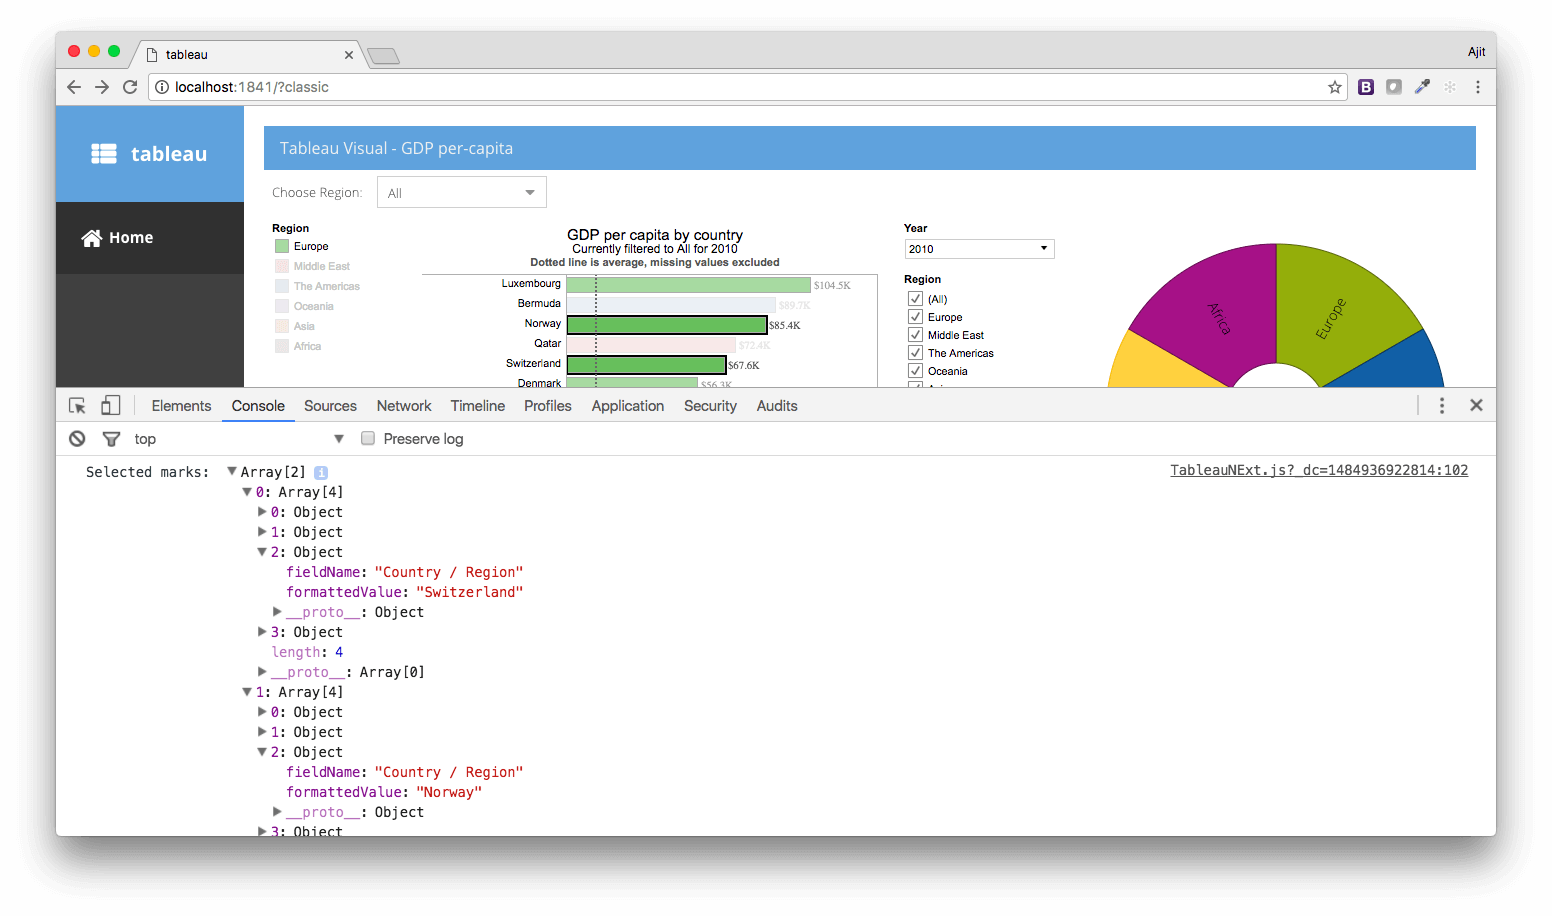
Next, handle the marksselected event in the tableau.view.main.TableauNExt class:
viz.on('marksselected', function(cmp, marks) {
    console.log('Selected marks: ', marks);
});
Reload the application, select a few markers, and you’ll be able to see the handler logging them in the console, as shown below:
Summary
There’s more to Tableau JavaScript APIs and the use cases around it. In this article, we looked at how you can render a Tableau visual inside an Ext JS application and build two-way data flow between a Tableau visual and Ext JS components. This makes it easier to bring any of your Tableau visuals to Ext JS based customer facing applications and link information with actions.
References
Did you find the content helpful?
 0
0

 0
0

Latest Content

How to Write Unit Tests with Sencha Test
In modern software development, unit testing has become an essential practice to ensure the quality…
April 19, 2024

Highlights of Virtual JS Days 2024
Highlights of Virtual JS Days 2024 From February 20-22, 2024, we held the third Virtual…
March 12, 2024

From the GM’s Desk 2023: An Exciting Year for Sencha & Ext JS 7.7
We are past the midpoint of 2023 and we are very proud of what we…
August 11, 2023