Sencha
Sencha

MODERN GUIDE TO FINANCIAL TECH APPLICATION DEVELOPMENT

Kirti Joshi

Growth of Financial Tech Applications

Growth of Financial Tech Applications

Over the past decade or more, financial technology (fintech for short) has revolutionized the way businesses and consumers conduct and manage financial transactions. Fintech, defined as the us of modern technology to automate the usage and delivery of financial services, has rapidly accelerated the development of financial applications. This modern approach combined with the larger adoption of smart devices is making financial transactions easy and convenient to manage—all through a click or tap of a button. As applications are becoming secure and user-friendly, consumers and businesses are getting more comfortable with controlling their finances through mobile banking and fintech applications. According to a recent Statista report,1 the market’s largest segment, digital payments, is expected to grow to $4,475.40 million USD by the year 2023, followed by personal finance and lending.
Fintech, a combination of financial services and technology, covers a large spectrum of money management applications such as payment transactions, crowdsourcing, cryptocurrency, stock trading, insurance, retail banking, lending, educational funds, and more.
If you are curious about the essentials of financial charting and dashboards in your financial applications, and the top factors to consider while designing fintech apps, then this guide is for you! Learn how Sencha products can help your enterprise build and deploy elegant-looking, secure applications faster and at lower costs.
1

Financial Charting

Have your ever interacted with data-rich applications that didn’t have the option to provide a quick visual summary or view customization through intuitive graphs or charts? It can get quite difficult and frustrating to navigate unoptimized interfaces, especially when it involves complex pieces of financial data. While many modern, feature-rich financial applications available in the market offer the elegant-looking graphical and customization options expected by users, a large subset does not have the key essential visual elements or customisations built in.
Whether you are managing your finances through mobile banking, making small to large investments through sophisticated fintech apps such as UBS or Fidelity; engaging in money transfers through Paypal(R), Zelle(R), or Xoom; or simply managing educational saving plans, financial charting is the bread and butter of well-designed applications.
Financial graphs and charts visually track key financial metrics such as budgets, liquidity, transaction history, P&L business indicators, expenses, contributions, and trends in real time.
With the most basic to sophisticated solutions, a variety of charting options are available for your fintech applications. Here is a list of popular charts and their usage significance.
Financial Charting
2

1LINE CHARTS, BAR CHARTS,
AND AREA CHARTS

These charts (basic, 3D, stacked varieties) provide a simplistic, easy-to-digest, visual representation of complex data. Even though these are basic charts, they convey the information quickly and are an integral component of financial trackers.

Shown charts generated with Sencha Ext JS
3

2GAUGE
CHARTS

Gauge charts are perfect for graphing a single data point and showing where the result falls on a scale (0% to 100% or good to bad). This chart, often used to show key financial indicators such as operating margin, operating profit, company revenue, and similar KPIs, provides a color-coded, easy-to-read visual data representation.
Gauge charts

3PIE
CHARTS

Pie charts (basic, spie, donut, 3-D) show the numerical data proportion via a “sliced” view. Donut charts are popular in financial applications due to their ability to use the space inside the donut more efficiently to display information.

Pie charts
Shown chart generated with Sencha Ext JS
4

4RADAR
CHARTS

Radar charts, also known as spider charts, are used to show the “scores” of multiple series or a comparison of multiple series in one unique view. Financial apps could use this type of chart for comparing different KPIs or a single KPI such as quarterly sales, revenue, or profit comparisons over a time period.
Radar charts
Shown chart generated with Sencha Ext JS

5COMBO
CHARTS

Combo charts combine multiple charts into one and are specially useful when presenting data series represented on multiple scales—for example, a Pareto analysis or bar graph with a trend line chart.
Combo charts
Shown chart generated with Sencha Ext JS
5

6OHLC BAR
CHARTS

OHLC charts track opening, closing, high, and low price points of financial assets (e.g., stocks, bonds) over a time period. The chart provides a visual representation of the trading period— whether it closed higher or lower than the opening price and its relationship between the stock’s highest and lowest prices. The color-coded bars indicate whether the opening price was above or below the closing price and is a direct indication of market volatility. A longer bar means more variation in the high and low prices and, as a result, more indecision in the market. The distance between the opening and closing prices also indicates volatility. If they are too close together, it signifies indecision. If the closing price is below the opening price, it signals a buy. Conversely, if the closing price is above the opening price, it signals a sell in that period.
OHLC bar charts

Shown chart generated with Sencha Ext JS

6

7CANDLESTICK
CHARTS

Candle stick Charts are popular pictorial charts that provide insight into the movements of current and future asset prices. Similar to OHLC charts, they have an open, close, high, and low indication via a boxed representation that is filled in or empty based on the open and close prices. A filled-in solid bar represents a closing price lower than the opening price, indicating a “bearish” or downward trending market (i.e., a sell signal). An unfilled bar indicates that the closing price is higher than the opening price, signaling an upward trend (i.e., a buy signal). While these are just basic patterns, there are various other methodologies to draw trading insights from the generated patterns.
Candlestick charts

Shown chart generated with Sencha Ext JS

Choosing the right charts to communicate the financial data story in a visually appealing format is essential to building successful enterprise-grade fintech apps.
7

Financial Dashboards

FLEXIBLE METHODOLOGY THAT ADAPTS TO CHANGE FASTER

Financial dashboards allow businesses and customers to track, analyze, and comprehend their financial performance and history through a broader, comprehensive interface. Dashboards provide a mechanism to condense complex pieces of data into an easy-to-understand graphical representation—all in a single, intuitive, navigable platform. These dashboards gather all the data, metrics, and insights to ensure the success of your financial performance, history, cash flows, management, and analysis. Here are a few examples of dashboards that you may come across:
  • Profit & Loss Dashboards summarize business revenue, expenses, gross, and operating profit margins
  •  Money Management Dashboards  show personal financial information such as investments, budgets, spending, accounts, cash flow, etc.
  • Investment Portfolio Dashboardstrack portfolio performance and allocations, and they report as well analyze stock investments and trends.
  • Stock Trading Dashboards provide a high-level view of the stock market so that day traders can analyze, manage, and react to fluctuations in this dynamic financial arena.
  • Accounting Dashboards help visualize real-time flow of invoices, accounts payable, accounts receivable, cash flow, and other key accounting metrics.
  • Financial Performance Dashboards provide a high-level view of the business’s revenue, cash flows, debts, and operating expenses.
Financial Dashboards
8

Considerations While Building Financial Apps

Fintech applications make finance easier and accessible to end users by removing any perceived barriers. Take the simple example of instant or international money transfers. Often considered a laborious process involving wire transfers, manual account verifications, currency conversions, and multiple hoops to jump through, instant money transfers have now boiled down to a click of a button. This advancement has revolutionized the realm of instant money transfers. To set your business apart from the competition, developers need to be aware of the key principles and features that matter to domain users. Here we discuss some considerations to be aware of while designing financial applications.

Security

Undoubtedly, digital security is the number one consideration when it comes to financial data. Starting with account authentication to secure data and money transfers, it is imperative to safely and securely authenticate all logins and transactions while providing complete user notifications and feedback. Fintech apps must make use of basic techniques—for instance, stronger password requirements (and changing those often)—as well as modern techniques such as two-factor authentication via one-time PIN, email or text notifications, biometric authentication (fingerprint/facial recognition), or even third-party apps that can provide additional protection. Where applicable, account aggregation or in-app bank verification will enhance the usability and convenience of the application.
Business P&L/Portfolio Dashboard generated using Sencha Ext JS
9

CLARITY THROUGH VISUALIZATION

Visualization is a key element to designing intuitive financial applications. As discussed in this guide, the correct type of financial charts and dashboards should be included for a single-view financial summary. For example, credit card-management or budget-management apps provide a single-page view of the account summary or KPIs with the appropriate visual graphs. Every fintech app should have built-in realtime analytics to closely track finances in views that present important data first while providing options to customize views. Shown here is an example of a spending view from Wells Fargo Budget Watch.

EXPLAINING THE WHY

Even though financial apps are subject to heavy regulatory rules and regulations, sensitive data collection and analysis is an essential requirement of these apps. Clearly explaining upfront why data through a certain form is required will inherently increase trust and ease end users’ minds as they provide the extra information.

EMBRACING ARTIFICIAL INTELLIGENCE TECHNIQUES

Techniques backed by artificial intelligence (AI), such as Chatbots, to automate simple tasks (opening new accounts or transferring money between accounts) or to provide assistance regarding banking or investing questions can create an engaging, customer-oriented environment. Implementing AI-driven, in-app, financial-advising forecasting tools for smarter saving or investing strategies can provide great end-user value
Money out of 12 month average
Spending view from Wells Fargo Budget Watch

ACCESSIBILITY

The American Disabilities Act (ADA) regulations require websites be accessible to people with disabilities. This means that web content should be accessible to people who are blind or deaf and those who need navigation assistance. With the wider adoption of technology, financial apps are subject to the same compliance, if not more. Adding in support for visually or audibly impaired customers with touchscreens, larger fonts, or navigation assistance via voice, screen readers, or other assistive technologies indicates that your app doesn’t just make financial access convenient but improves the overall quality of human life.
10

Sencha Products Simplify Fintech App Development

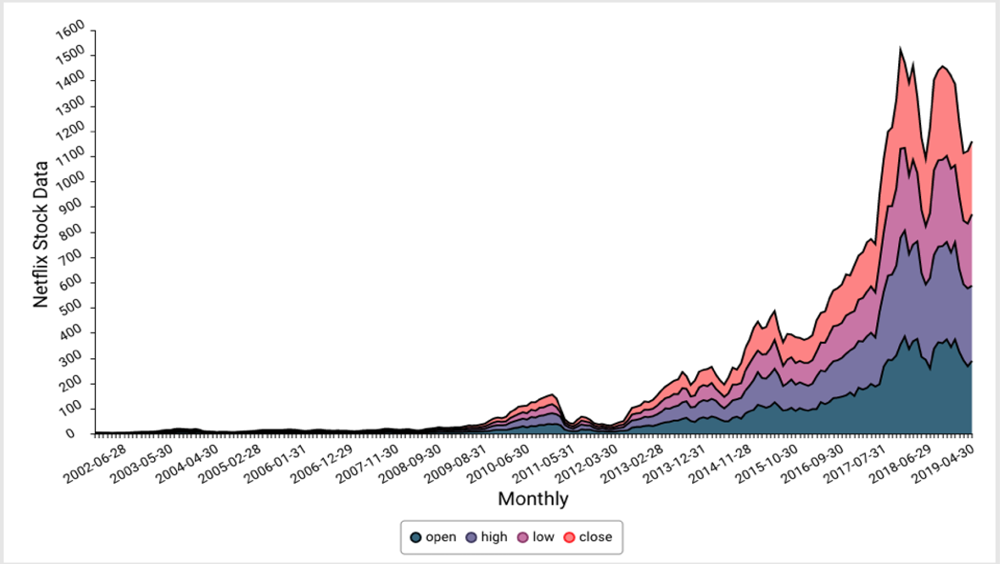
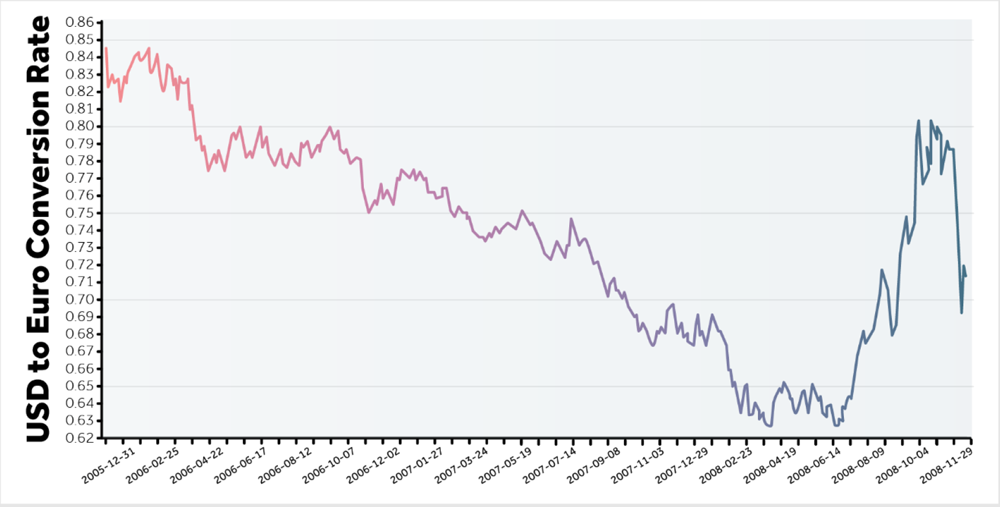
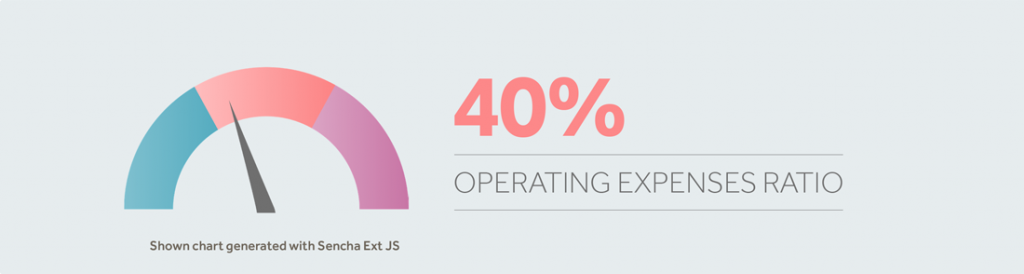
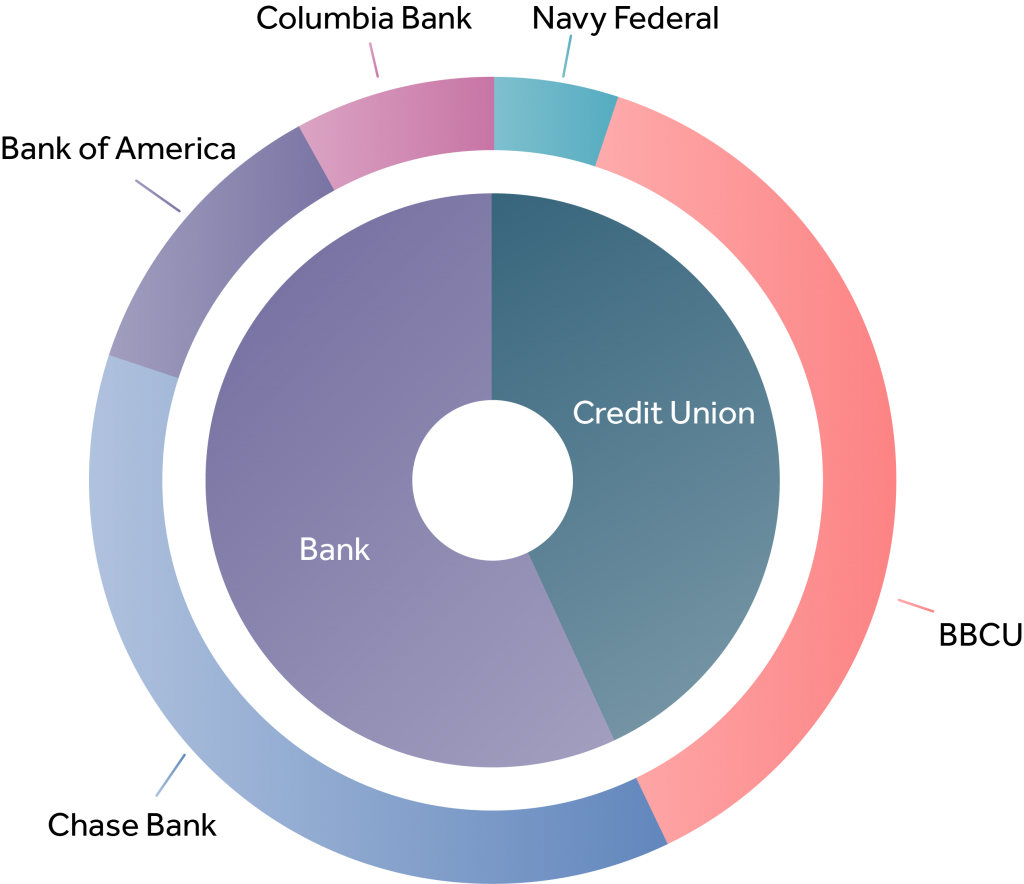
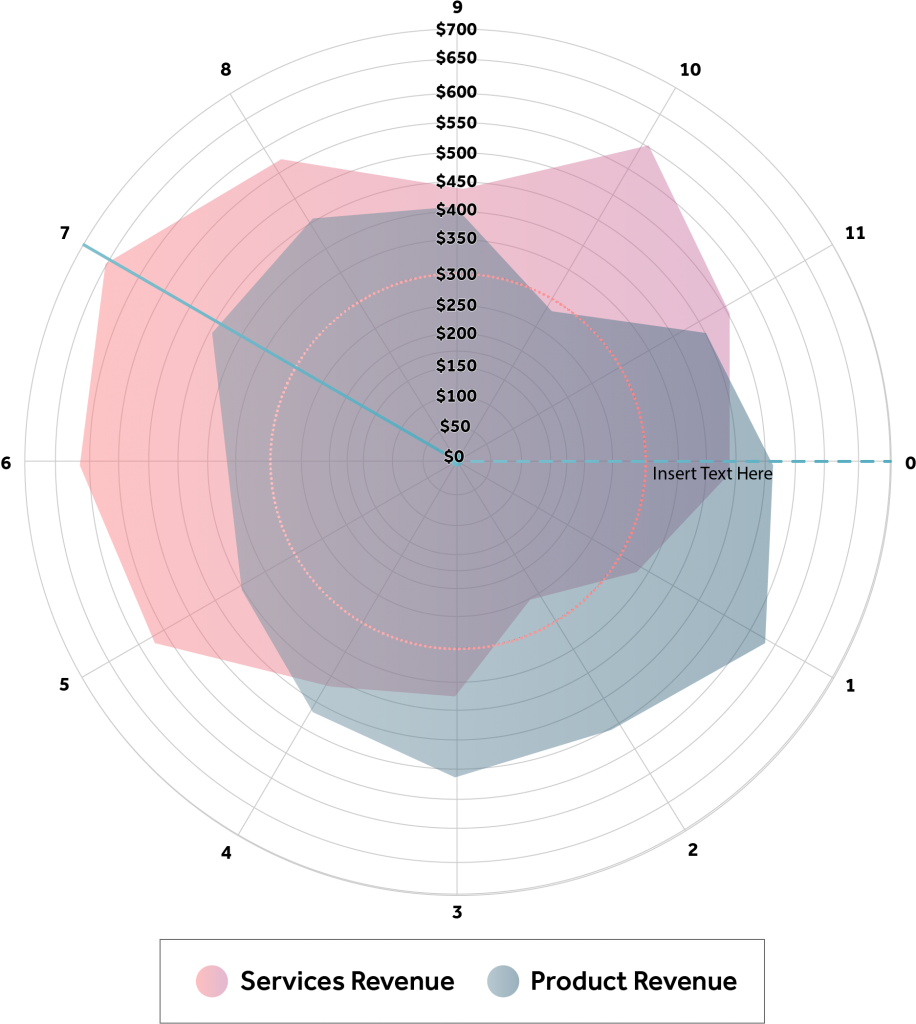
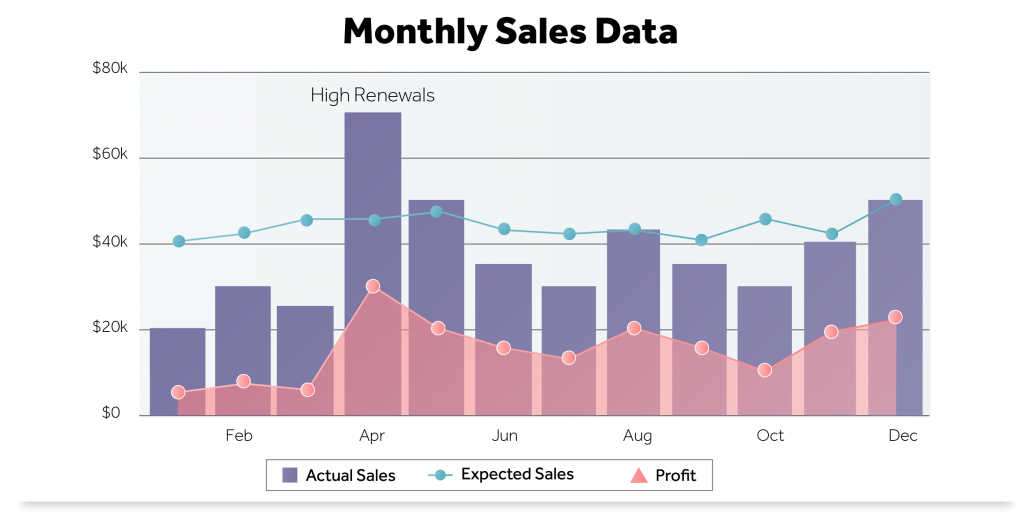
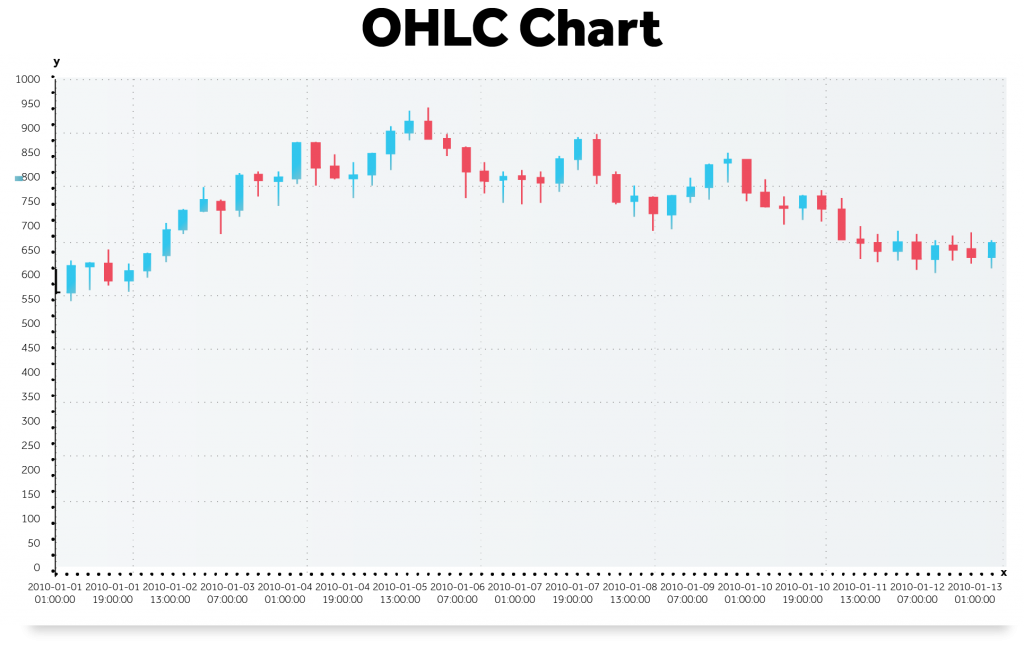
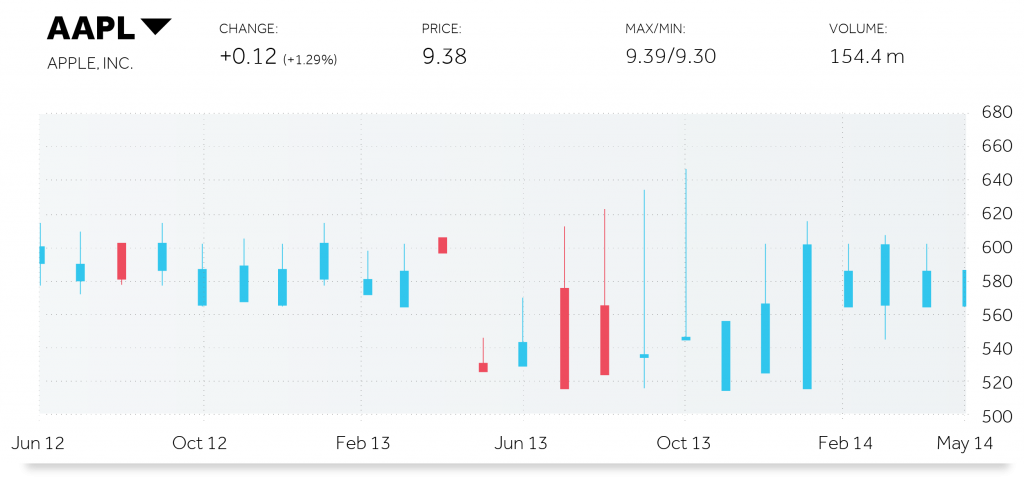
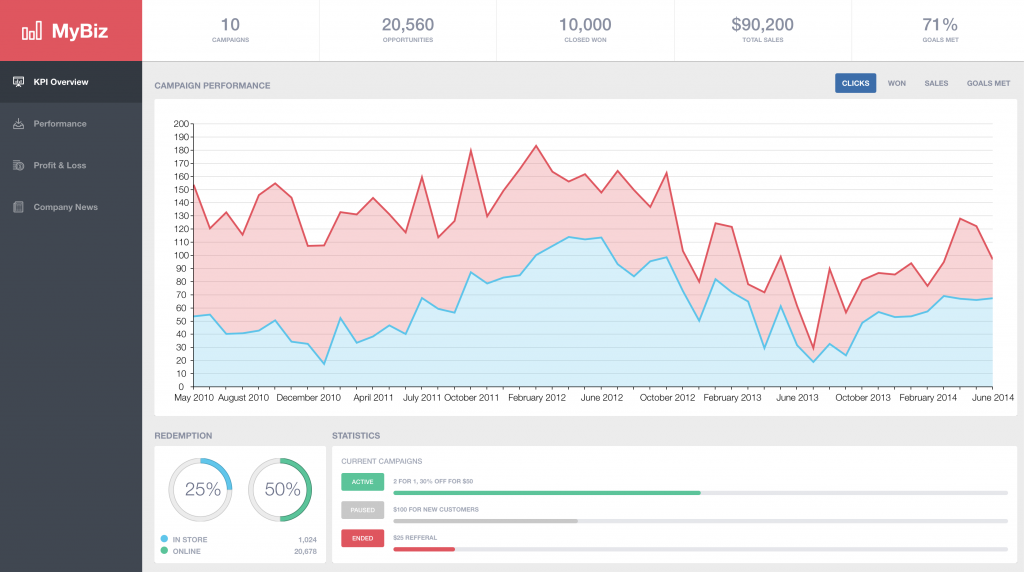
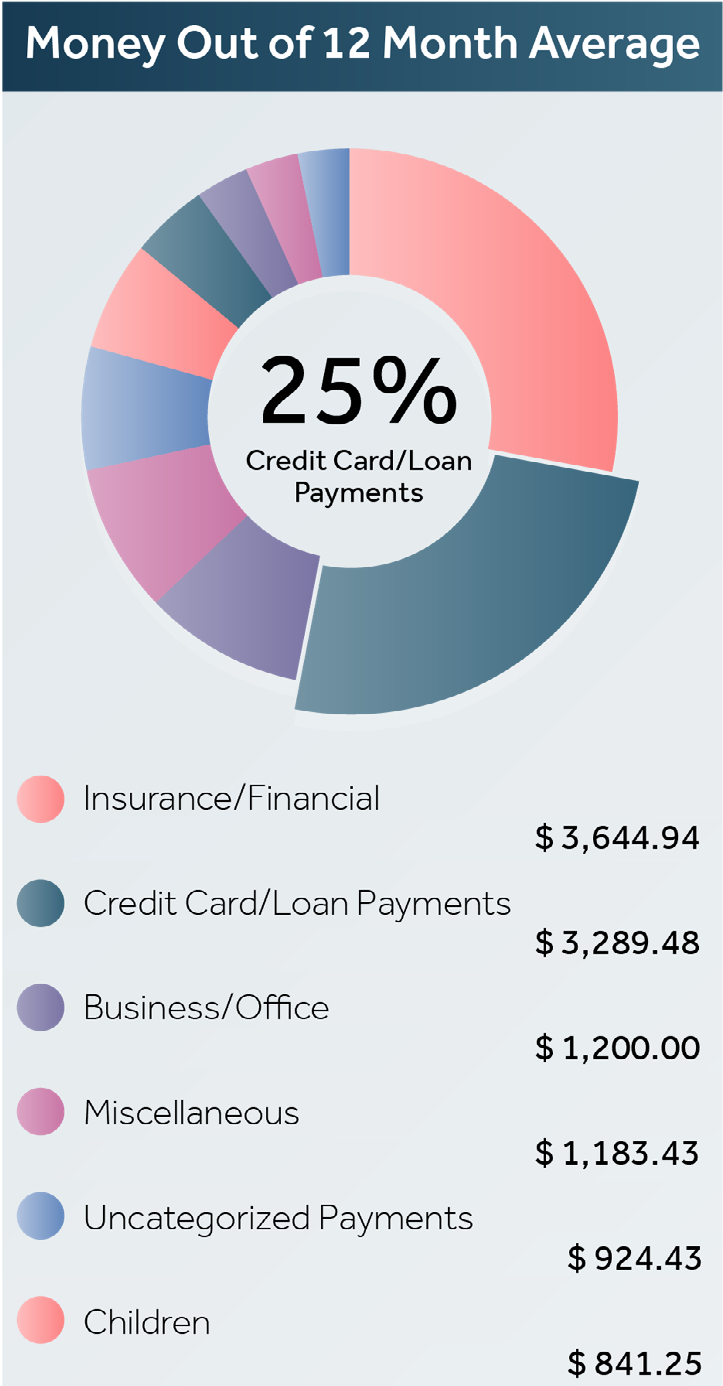
Sencha is a one-stop-shop solution for enterprise-grade app development. With all the charting components (line charts, bar graphs, area charts, stacked charts, combo charts, financial charts, scatter charts, box plots, plus many more) and widgets (grids, buttons, forms, calendars, trees, and more) combined with themes and layout options, you can rest assured that you will find everything required in one central place! Creating visually appealing financial dashboards is simpler when you don’t need to scout for components. Sencha’s UI components are architected to interoperate well—so end users spend less time debugging and more time designing and developing high-performing applications.
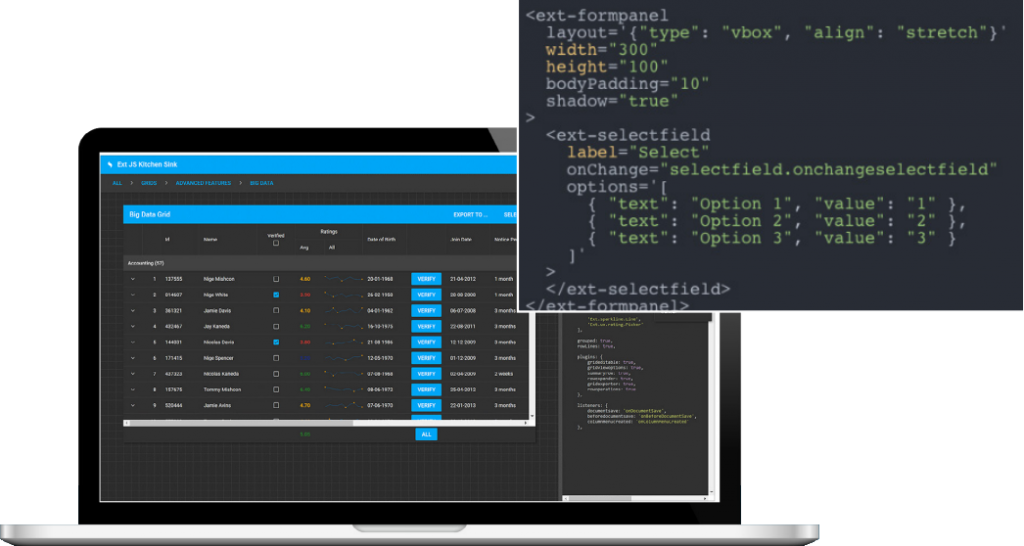
Sencha Ext JS framework and tools provide a robust, secure platform for developing “universal” apps, which means you develop only once and deploy seamlessly on all platforms—mobile, desktop, and web. Simplify app development with a complete end-to-end solution with modern design, development, and test tools such as Sencha Themer, Architect, Test, and Stencils.

KEY SENCHA BENEFITS

Quotes
Our decision to leverage Sencha came down to a few key points—developer productivity, and the ability to rapidly prototype…. With Ext JS our developers can quickly roll out custom controls and features that are most important to our financial clients….
eVestment
Providing solutions for asset managers, hedge fund managers, and investors
Quotes

Glimpse of Our Fintech Customers

Glimpse of Our Fintech Customers

Sources: 1Statista 2019 Report, “Fintech worldwide.” May 2019.

11
Ext JS Kitchen Sink

Save time and money.

Make the right decision for your business.
Sencha
12

coming soon

Something Awesome Is

COMING SOON!