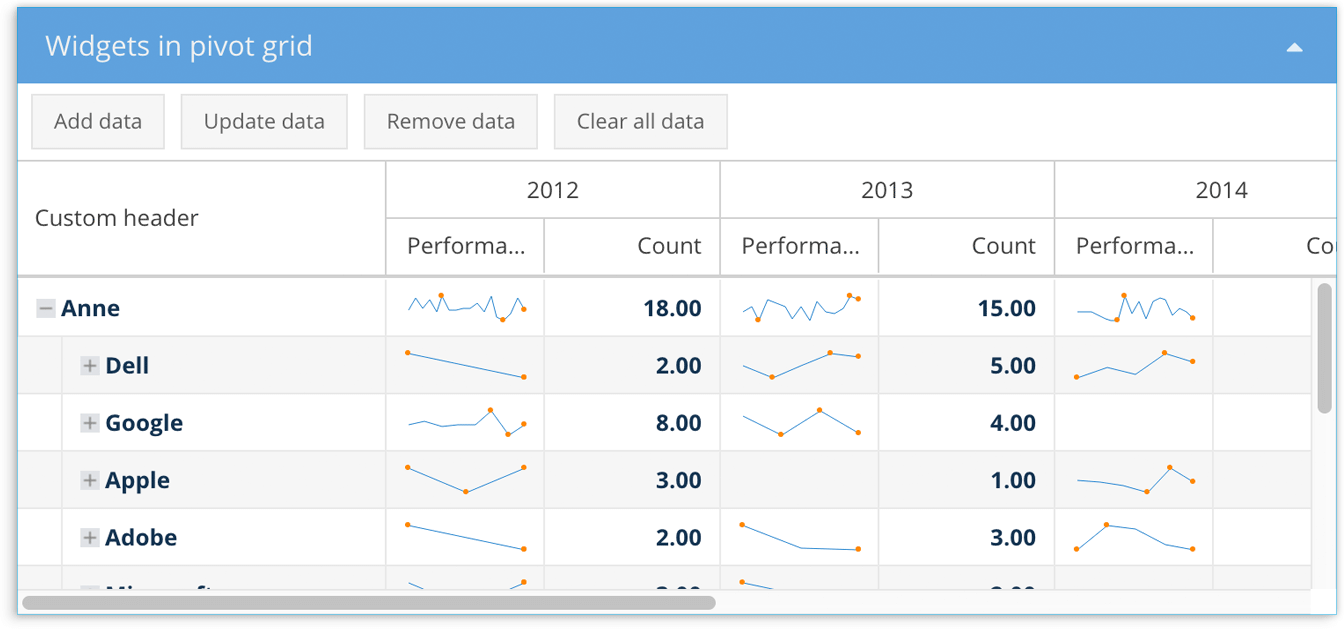
With the Ext JS Grid component, developers can easily add powerful data analytics
capabilities to their web applications. The grid can handle millions of records and
provides built-in functionality such as sorting, grouping, and summary rows.
Play with the Ext JS Grid
Want to see why over 10,000 global customers, including 60% of the fortune 100, rely on our Java and JavaScript frameworks
and components? See the full capabilities of our powerful Grid component in the example below. Not convinced?
Download a free 30-day trial of Ext JS to learn even more and explore at your own pace.
Feature Overview
A grid can be one of the trickiest and most complex UI components to build. If you’re developing a data- driven web application, chances are you’ll use a grid or spreadsheet-like interface at some point to display data for your users. Depending on the context, your users may expect the grid in your application to be capable of:
- Scrolling with a fixed header
- Sorting by clicking on a column header
- Showing and hiding specific columns
- Paging, grouping, and summarization
- Editing data in cells
- Exporting to Excel
- Drilling down/row expansion
Pivot Grid

Looking to slice, dice and filter your multidimensional data even further? Pivot Grid enables rapid summarization of large sets of data. It provides a simple way to condense many data points into a format that makes trends and insights more apparent. Users can also easily summarize and analyze multidimensional data to make more informed decisions. Take me to Pivot Grid examples →
Compatible With Your Framework

The Ext JS Grid can be used not only as part of our Ext JS Premium and Enterprise framework packages, but is also easy to integrate into free open source frameworks like React and Angular.
If you’re interested in using Ext JS components with the React framework, you may want to try our ExtReact packages. You can also view our ExtReact Grid examples here.
