Rapid Ext JS (beta)


App Inspector for Sencha Touch and Ext JS Developers
March 12, 2014
108 Views
 Like many Sencha developers, I spend about half of my day writing JavaScript in my favorite IDE – but I spend the other half of my day testing and debugging my apps in the browser.
Over the past several years, each of the major browsers has significantly improved. HTML5 is now consistently supported across all browsers, JavaScript performance is excellent, and the developer tools are better than ever before.
Google Chrome is often the preferred browser for many developers, which is no surprise considering their developer tools have been ahead of this curve for some time. Chrome Developer Tools does a great job exposing DOM elements, CSS rules, JavaScript source code and more – but until recently Sencha developers have had little help truly dissecting their applications at runtime.
A few months ago the Sencha Professional Services team began exploring some ideas to debug customer applications more intelligently – and the App Inspector for Sencha was born.
Our team decided to share this tool with the community as part of our non-profit foundation, Sencha Labs, so anyone can contribute. App Inspector for Sencha 2.0 offers support for both Ext JS (4.x) and Sencha Touch (2.x) apps and is available now.

Features
The hardest part of debugging Sencha applications is that the browsers’ developer tools don’t understand the higher-level abstractions – things like Components, layouts, data, and Observable events.
While other debugging tools do exist in the Sencha ecosystem – Illuminations for Developers, the Ext JS Page Analyzer, and Sencha Fiddle to name a few – none of them filled the immediate needs of the Professional Services team. App Inspector for Sencha is not intended to replace any of these tools as they all have different features and use cases; rather App Inspector for Sencha helps you to analyze and understand any Ext JS and Touch application with easy-to-use tools.
As a free extension for Chrome, App Inspector for Sencha helps you debug apps in the following ways:
- Component Inspector: quickly and easily navigate the Component tree, highlighting components in the DOM and viewing their properties
- Store Inspector: view the data stores in your app and explore individual records
- Layout Profiles: intelligently dissect application layouts to identify potential performance and display problems
- Event Monitor: record Observable events
App Inspector for Sencha also detects the framework and package versions used in your application, so it’s easy to identify the specifications for individual applications.
Built with Sencha, by Sencha
While App Inspector for Sencha is an extension of Chrome Developer Tools, it is important to point out that it is built using Sencha technology.
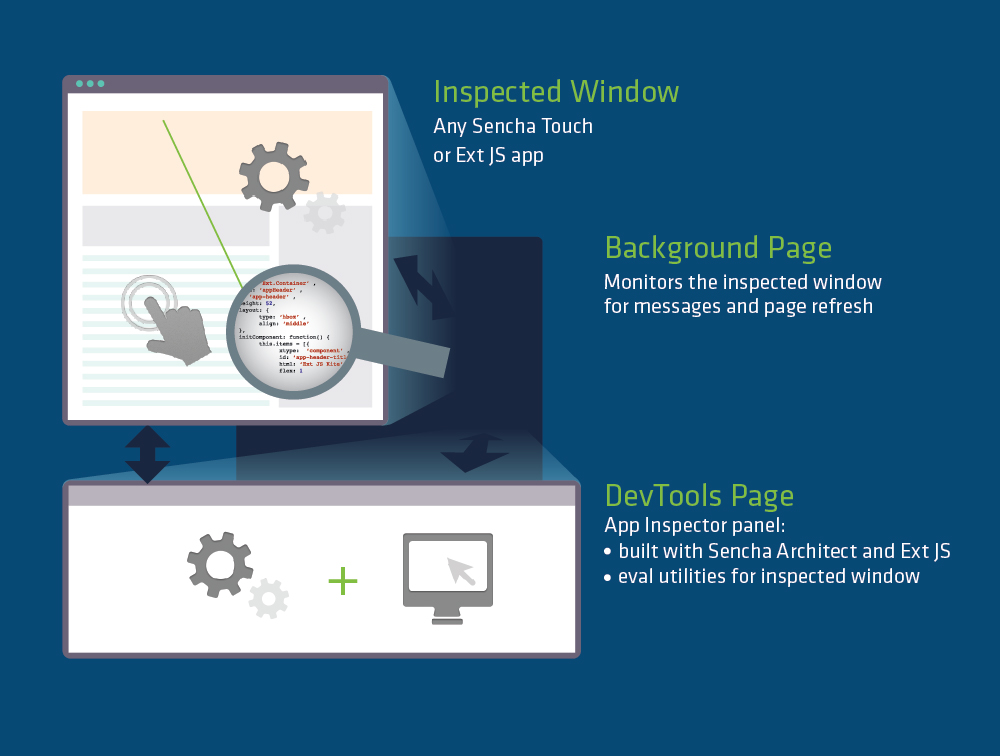
The architecture of a Chrome Developer Tools extension involves two parts: the Background page and the DevTools page. These two pieces interact with one another, but they also interact with the inspected window in different ways.
The Background page contains persistent code which initializes the extension and monitors the inspected window for events (e.g. page refresh). The Background page will then communicate information about the inspected window to our DevTools page via the postMessage API.
The DevTools page contains the code needed for individual instances of Chrome developer tools (i.e. each browser tab). The entire interface of App Inspector for Sencha was built using Sencha Architect and Ext JS, including the many theme modifications. A few utility classes (specific to Ext JS or Touch) were also written in order for our DevTools page to communicate with the inspected application via the inspectedWindow API.
Last but not least, we use Sencha Cmd in combination with Node.js and Grunt to automate our build process. Our code must first pass JSHint validation, then the application runs a production build, and finally all additional resources are bundled together for our Chrome Web Store deployment package. We even build some internal documentation using JSDuck.
Our goal for this project was to show how easy it is to build powerful apps using Sencha technology, so take a look at our code and view our screencast. We hope you will offer some feedback and make contributions of your own.
Did you find the content helpful?
 0
0

 0
0

Latest Content

How to Write Unit Tests with Sencha Test
In modern software development, unit testing has become an essential practice to ensure the quality…
April 19, 2024

Highlights of Virtual JS Days 2024
Highlights of Virtual JS Days 2024 From February 20-22, 2024, we held the third Virtual…
March 12, 2024

From the GM’s Desk 2023: An Exciting Year for Sencha & Ext JS 7.7
We are past the midpoint of 2023 and we are very proud of what we…
August 11, 2023