Rapid Ext JS


Sneak Peek: Sencha Visual Studio Code Plugin
November 1, 2016
187 Views
We’re just days away from SenchaCon 2016, where we’ll be introducing a brand new Ext JS tool – a plugin for Microsoft Visual Studio Code source editor. Join Ryan Salva, Microsoft Principal Program Manager, and me for our session: Learn Cross-Platform Mobile App Development with Cordova and Visual Studio.
You’ll learn how you can use Visual Studio Code and Sencha Visual Studio Code plugin to speed up your Ext JS app development. We’ll cover the top features of Visual Studio Code, Sencha Visual Studio Code plugin, and use Microsoft extensions to create and debug mobile applications.
Don’t have your ticket yet for SenchaCon 2016? Register today because tomorrow is the last day for online registration.
Now, I’m going to show you how to debug Ext JS apps using Microsoft Visual Studio Code extension – Debugger for Chrome.
Debugging Ext JS Apps with Visual Studio Code
Debugging apps using breakpoints, stepping through code, and watching variables is very common in Java and .Net development environments, but good tools for web developers are limited. Microsoft Visual Studio Code provides an extension called “Debugger for Chrome” that helps you with debugging Ext JS web apps.
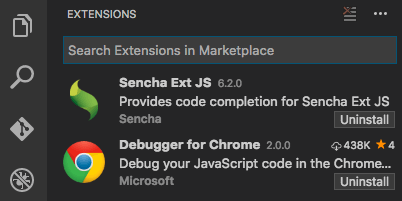
To get started, go to Visual Studio Code, and just search for and install “Debugger for Chrome” extension.
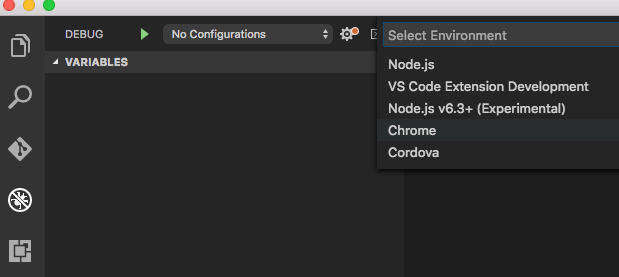
From the Debug tab, select Configure, and select Chrome.
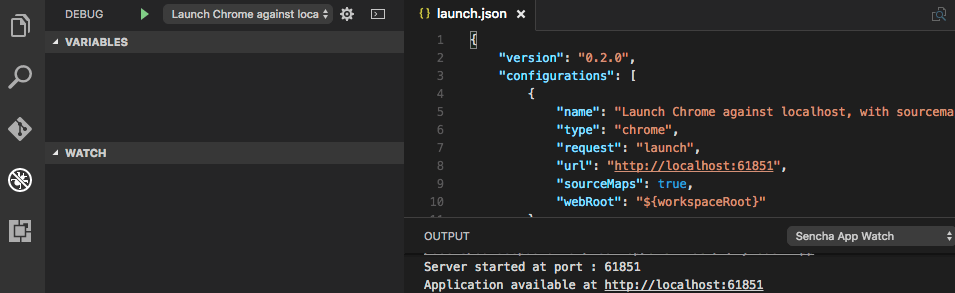
Visual Studio Code will now create an initial launch configuration. Please update the URL in the launch.json to point to your Ext JS app.
Launch Chrome with remote debugging enabled, so the extension attaches to it. In a terminal, execute /Applications/Google\ Chrome.app/Contents/MacOS/Google\ Chrome –remote-debugging-port=9222
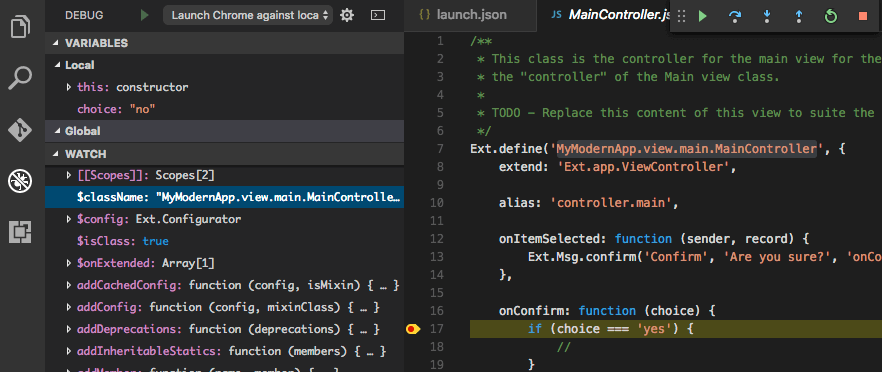
Now, you can start debugging (F5), add breakpoints, step through Ext JS code, and watch the call stack.
Join us at SenchaCon for our session, where we’ll show you all of the details and how to use Visual Studio Code plugin.
If you’re interested in what’s new in Architect 4.1 and Themer 1.1, I have another SenchaCon session, Web Development at the Speed of Thought: Succeeding in the App Economy, where I’ll go over speeding up development using various Ext JS tools including Architect, Themer, Sencha Inspector, and Stencils.
See you in Las Vegas!
Did you find the content helpful?
 0
0

 0
0

Latest Content

Ext JS 7.8 Has Arrived!
The Sencha team is pleased to announce the latest Ext JS version 7.8 release. Following…
May 13, 2024

React Apps Development Using ReExt with Ext JS Components
The world is moving fast towards online businesses. Businesses are established online via social media,…
May 1, 2024

How to Write Unit Tests with Sencha Test
In modern software development, unit testing has become an essential practice to ensure the quality…
April 19, 2024