Using the Ext JS D3 Adapter to Create a Custom Data Visualization
September 6, 2017
171 Views
The Ext JS D3 Adapter offers you amazing built-in data visualization components including heatmap, treemap, sunburst, and more, and it also gives you complete flexibility to create your own visualizations. You can pick any visualization from the D3.js gallery and create an Ext JS component based on it.
In this article, I’ll introduce several concepts, components, and utility classes, and I’ll walk you through the steps to build your custom data visualization component.
Sencha App Camps – Register Today
To learn more, please register for our Data Visualization App Camps taking place in London on October 4th and Munich on October 12th.
Steps to Create a Custom Visualization
- Choose the base visualization
- Choose an engine: SVG or Canvas
- Define data requirements
- Define axes
- Define legend requirements
- Define tooltip requirements
Now, I’ll go through each step in more detail. I’ll use the following example which is a visualization showing average income in different states.
Example Visualization
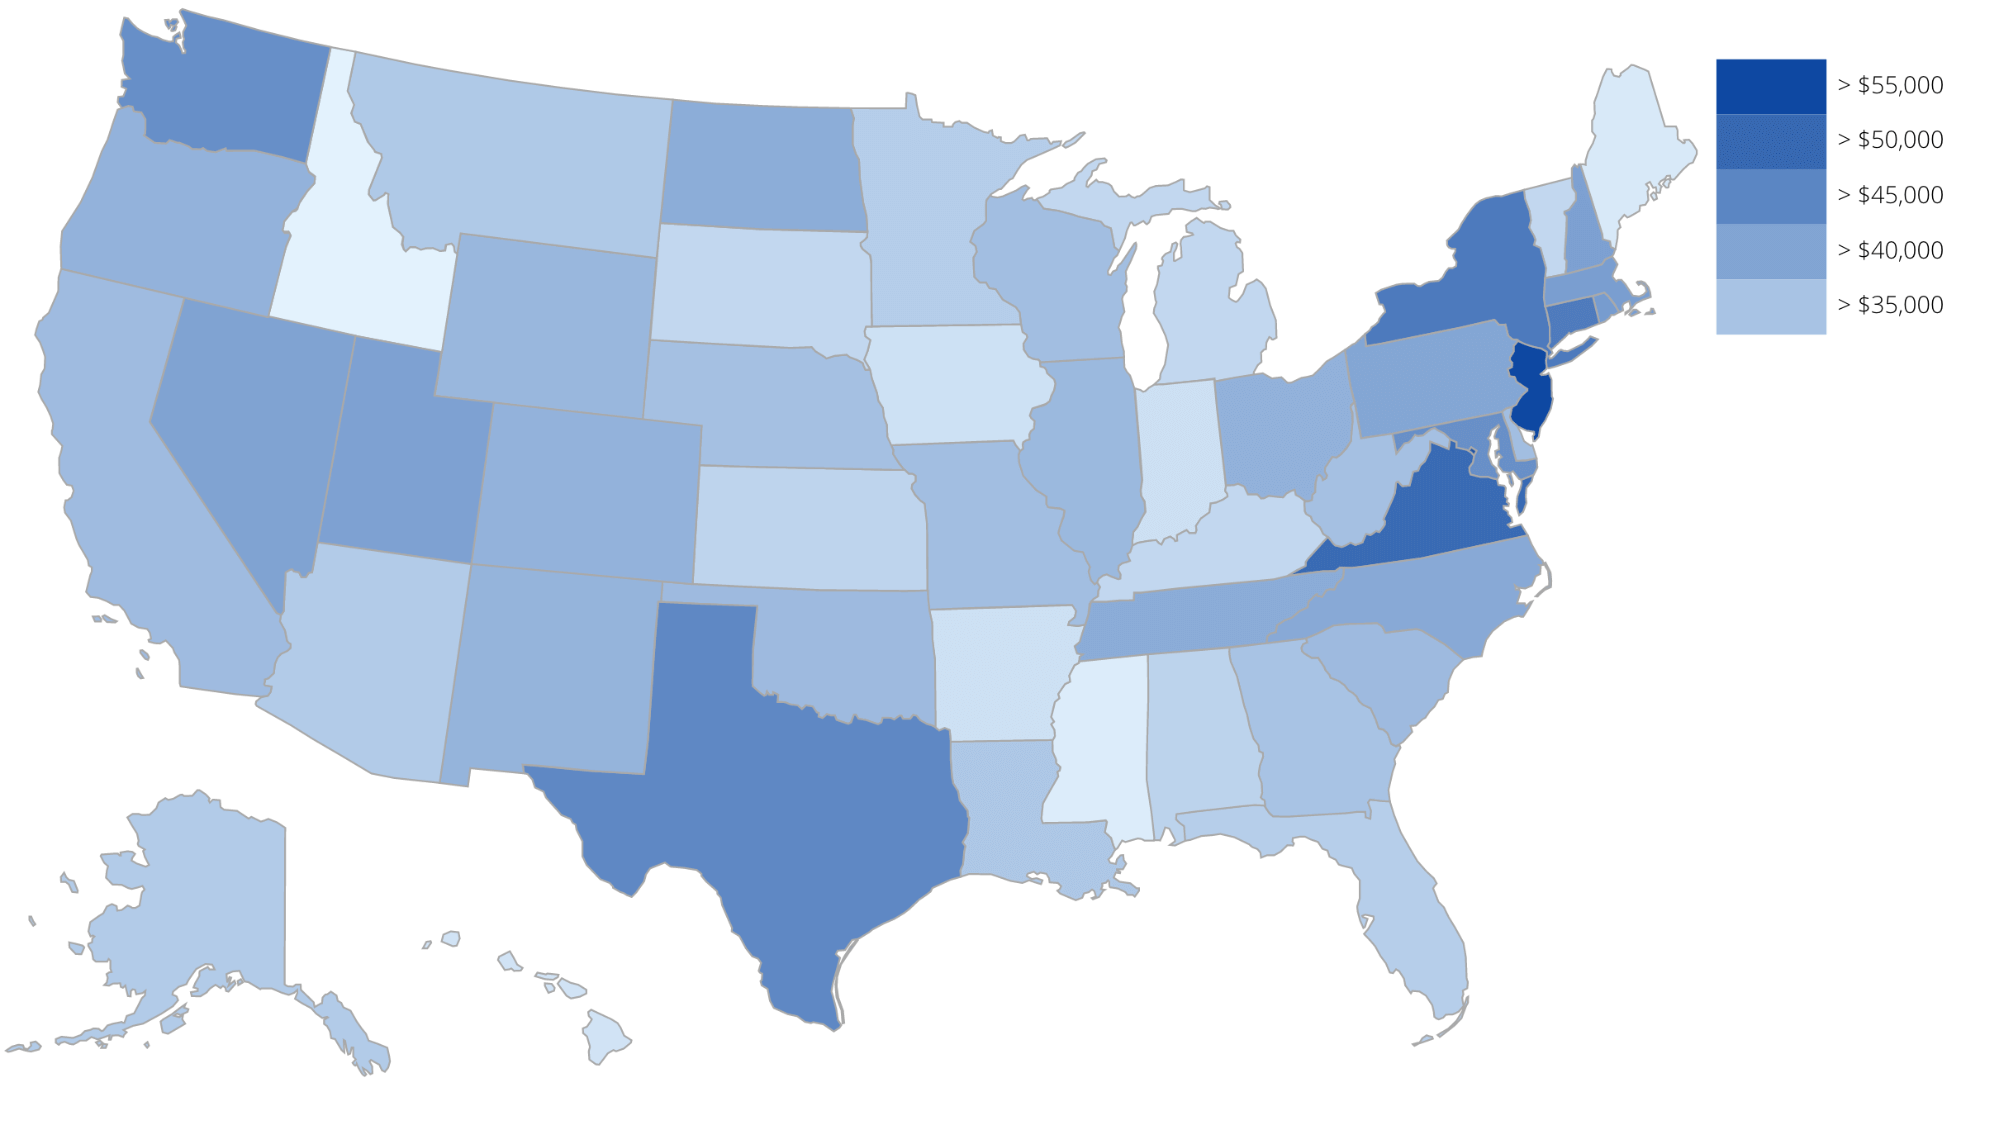
Step 1: Base Visualization
First, I suggest you find a d3.js visualization that comes close to meeting your requirements. You could use one of the samples from the d3.js gallery or any other resource. This visualization is the base for my example:

Step 2: Visualization Engine – SVG or Canvas
Scalable Vector Graphics (SVG) is an XML-based vector image format for two-dimensional graphics with support for interactivity and animation.
The Canvas element is part of HTML5 and allows for dynamic, scriptable rendering of 2D shapes and bitmap images.
The Ext JS D3 Adapter supports both engines, so you’re free to choose. Here are some things to consider when making your choice.
SVG
All major modern web browsers – including Mozilla Firefox, Internet Explorer, Google Chrome, Opera, Safari, and Microsoft Edge – have at least some degree of SVG rendering support.
Advantages
- Event handling: every item is a separate DOM element. The SVG enables event handlers to be associated with objects, so a rectangle responds to an onClick event.
- Easy modification: every item can be modified independently.
Disadvantages
Memory usage: every item is a separate DOM element, so if you have a lot of elements in your visualization, it could be a bottleneck and impact performance.
Canvas
The Canvas element is supported by the current versions of Mozilla Firefox, Google Chrome, Internet Explorer, Safari, Konqueror and Opera.
Advantages
- Memory usage: Canvas is a single DOM object, so the page DOM model size remains stable when you add new elements to the Canvas.
Disadvantages
- Event handling: To get event handling with Canvas, you have to manually match the coordinates of the mouse click with the coordinates of the drawn rectangle to determine whether it was clicked.
- Any modification requires a full redraw of the Canvas.
My Choice
For my visualization component, I’ve chosen an SVG engine for the following reasons:
- The item count isn’t very big: I have only 50 states
- Easy event handling
- Easy modification
Step 3: Data Definition
To build my visualization, I need flat data that includes average income value for every state. I can use Ext.data.Store class because my model only has to include two fields:
- The “state” field will store the US state
- The “value” field will store the average income value
Step 4: Axes Definition
For my visualization, I use two axes:
- The mapAxis uses the “state” field to point to the state on the map
- The colorAxis uses the “value” field to illustrate the average income with the specific color
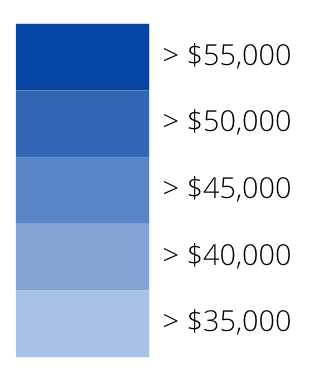
Step 5: Legend Definition
My legend includes:
- Color ticks
- Associated values with formatting
Step 6: Tooltip Definition
The tooltip template looks like this:
[“state” field’s value]: $[”value” field’s value]

Visualization Base Classes
Every concept that I discussed in the steps above – Graphical Engine, Axis, Legend, and Tooltip – has a separate class in Ext JS that you can easily use when building your own custom visualization.
Component Base Classes
Ext.d3.svg.Svg
xtype: d3
The base class of every SVG D3 Component can also be used standalone. I won’t use the base class for the US states visualization.
The class has two important events:
- scenesetup – fires once after the scene has been created
- sceneresize – fires after scene size has changed
Both events could be used to draw the visualization.
Ext.d3.canvas.Canvas
xtype: d3-canvas
The base class of every Canvas D3 Component can also be used standalone. I will not use this class in my visualization component.
Store Base Classes
- The Ext.data.Store is used to store flat data that will be displayed in the visualization. This is the base class for the store that I’ll use in my visualization component.
- The Ext.data.TreeStore is used to store hierarchical data that will be displayed in the visualization. I won’t be using this class in my visualization component.
Axis Base Classes
The Ext.d3.axis.Axis class is used to display reference lines for D3 scales. The Ext.d3.axis.Axis component wraps it with an added ability to display an axis title in the user-specified position.
Ext.d3.axis.Data is a sub-class of Ext.d3.axis.Axis that holds extra information needed for use with stores. This will be the base class for my mapAxis.
The Ext.d3.axis.Color maps data values to colors. This will be the base class for my colorAxis.
Legend Base Class
The Ext.d3.legend.Color is designed to work with the Ext.d3.axis.Color axis and present the range of possible values in various ways. This will be the base class for my legend.
Tooltip Base Class
The ToolTip mixin is used to add Ext.tip.ToolTip support to various D3 components. This will be the base class for my tooltip.
Next Steps
To build a custom visualization component, I need to extend the base visualization class by following these steps: bind the store with the data to visualize, implement handlers for scenesetup and sceneresize events that will draw and resize the d3.js visualization, and add instances of Axis, Legend, and Tooltip classes to draw axes, legend, and tooltips.
To learn the step-by-step process of combining these classes together to build a great looking custom data visualization, please register for our Data Visualization App Camps taking place in London on October 4th and Munich on October 12th. At the App Camp, I’ll also cover advanced customization of built-in d3.js visualization components and data aggregation with Pivot Grids.
Did you find the content helpful?
 0
0

 0
0

Latest Content

Introducing Rapid Ext JS: The Ultimate Low-Code Editor for Ext JS Development
We’re excited to announce the official release of Rapid Ext JS 1.0, a revolutionary low-code…
August 21, 2024

Sencha Architect 4.3.6 Has Arrived!
The Sencha team is pleased to announce the availability of Sencha Architect version 4.3.6. Building…
August 20, 2024

Introducing ReExt: A Game-Changer for React Developers
Sencha, a leader in JavaScript developer tools for building cross-platform and enterprise web applications, is…
August 20, 2024