Using GapDebug to Test Hybrid Web Apps Built with Sencha Frameworks
Introduction
 Developers have been using PhoneGap (and subsequently Cordova) to deploy hybrid mobile applications since 2009, when it was first created. By allowing web applications to run on native devices, the HTML5 community fully embraced PhoneGap and thousands of apps have since been released on iOS, Android and a wide variety of other platforms. But while the wrapper itself is great, unfortunately the debugging tools have lagged far behind their browser counterparts — and debugging across multiple platforms has often been painful.
In this post, we’ll introduce you to the new Genuitec GapDebug tool and explain how it makes debugging hybrid applications deployed with PhoneGap far easier than ever before. We will also compare GapDebug to the popular Weinre debugger and highlight the key differences between them.
 GapDebug
GapDebug is a free cross-platform mobile app debugger developed by Genuitec for use with Android and iOS PhoneGap (or Cordova) applications. It runs on both Windows and Mac OSX and is packed full of killer features for exploring every aspect of a hybrid app’s state and execution.
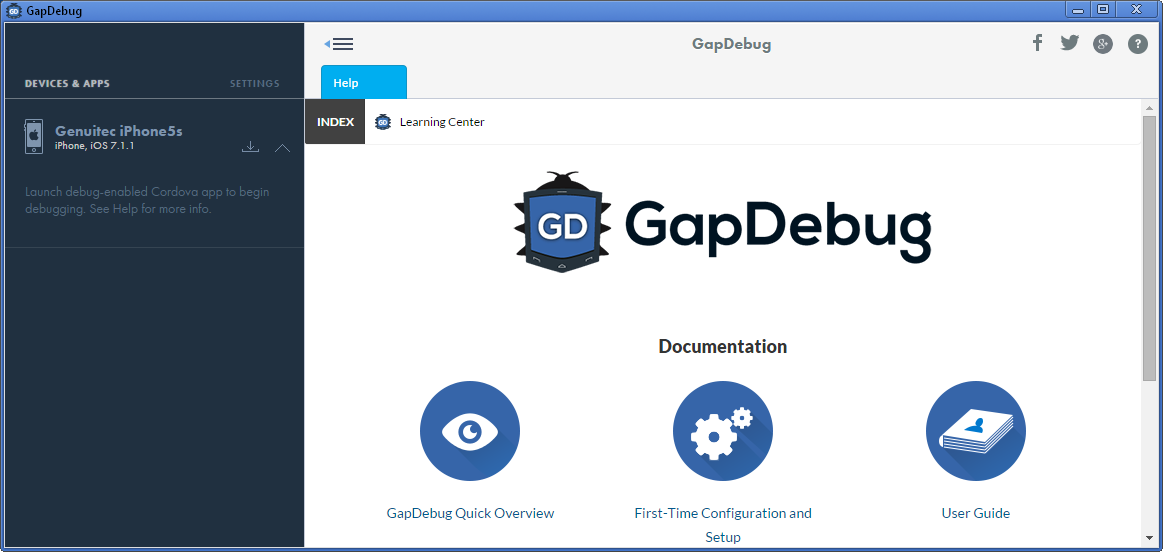
Many Sencha developers use Cordova or PhoneGap every day to deploy their hybrid applications — but debugging an HTML5 app directly from the device can be a very frustrating experience. GapDebug makes this process much easier, using a single interface for all apps and devices, and without requiring the developer to add special code.
How GapDebug Works – Plug and Debug
Before you can begin debugging, your iOS or Android devices require a simple 1-time configuration as outlined here. With your device configured, simply plug and debug by connecting your device to the GapDebug host computer using a USB cable. The device may prompt you to approve the connection. Once the connection is completed, the device info will appear on the left of the GapDebug user interface in the Device Panel.
On the mobile device, launch the app that you wish to debug. If the app is not already present or up to date on the device, use the app installation button  found next to the device info to select and install a new version of the app. Alternatively, you can drag and drop a binary app executable file on the device to install it. When the app is launched, the app’s ID and icon will appear just under the device in the GapDebug Device Panel.
Selecting the app in the Device Panel will start a debug Inspector in a new tab pane on the right side of GapDebug user interface. Two versions of the inspector are provided: for iOS apps a custom version of Apple’s Safari Webkit Inspector is presented, while Android apps get a custom version of the Chrome Developer Tools.
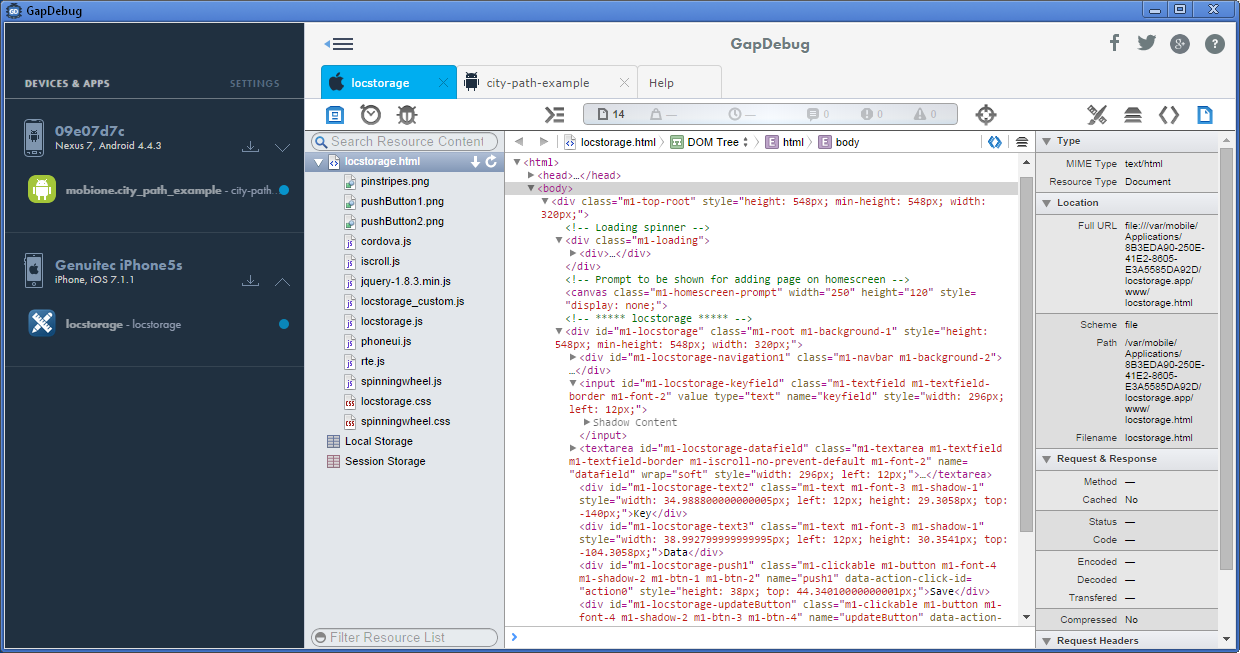
GapDebug (Windows version)
Before we dig in and start debugging, let’s first examine how GapDebug is different than the popular debugging tool Weinre.
GapDebug vs Weinre
Until GapDebug, Weinre was the go-to cross platform debugger for PhoneGap apps. Weinre was developed in early 2011 by Patrick Meuller as an open source solution for remote debugging of iOS and Android PhoneGap applications. It consists of a JavaScript library that is dynamically loaded by the app at startup, a debugger user interface that runs in your browser, and a server that handles communications between the application and the user interface.
Weinre is implemented in JavaScript and requires Node.js to install and execute locally, although you can avoid setting up a local installation by using one of several freely available online Weinre servers.
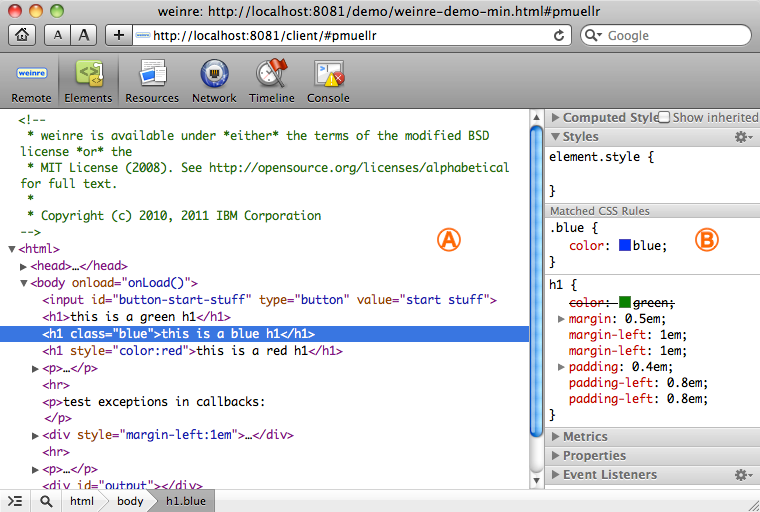
Weinre debugger user interface
While Weinre remains an innovative tool, it is beginning to show its age. Let’s look at some of the pros and cons of using Weinre:
Pros
- The debugger provides tools for DOM and CSS inspection, resource browsing and analysis, and a JavaScript console
- Developers can simultaneously debug multiple apps across multiple devices
- Mobile devices only require a network connection, no USB tether required
- No special device configuration required
- Weinre debugging works for a wider range of iOS and Android OS versions than GapDebug. (GapDebug supports Android v4.4 and above and iOS v5 and above)
- Open source under Apache license
Cons
- The Weinre user interface is a dated version of the WebKit Inspector
- No JavaScript debugging and profiling
- Not easy to reload the app for testing events such as deviceready
- Requires modification of application code to include a special instrumentation script
- Device must be online with a network connection, can’t debug offline scenarios
- Requires processing time for communication with remote Weinre server
- Server connection frequently times out, terminating your debug session unexpectedly
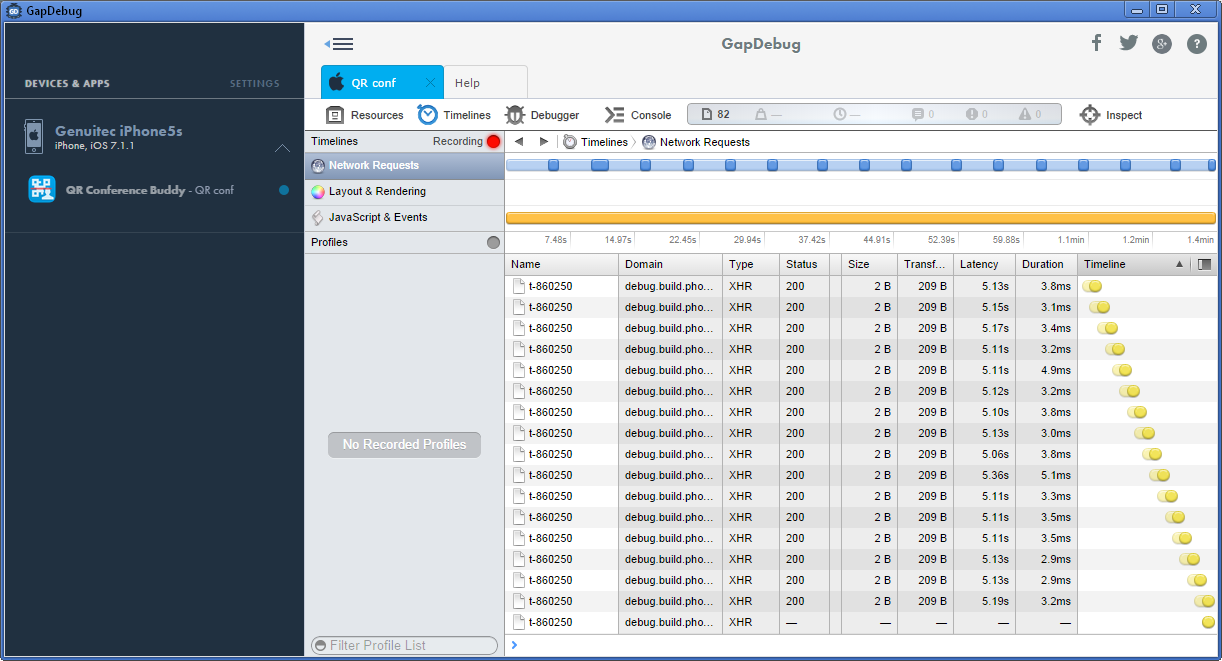
Using GapDebug to observe frequent Weinre network XHR activity in an application
By contrast, GapDebug first debuted in June 2014 and is being rapidly enhanced with monthly updates by a small team at Genuitec.
Pros
- Provides the most powerful hybrid app debugging features available through the use of special versions of Safari WebKit Inspector and Chrome Developer Tools
- Professional Windows and Mac OSX installers, with automatic updates
- Free for all users including commercial use
- Simultaneously debug multiple apps across multiple devices
- No requirement to modify application code with special instrumentation library
- Device does not require a network connection, can debug offline apps
- Easy app reloading to test events such as deviceready
- Windows users can remotely debug iOS apps
- Remotely view, control and debug Android apps over the internet
Cons
- USB tethering may be considered a negative by some users
- At this time, no common inspector UI (for cross-platform debugging, you must learn both the Safari WebKit Inspector tool and the Chrome Developer Tools — Genuitec is working towards a common UI in future release)
- Currently only supports Android v4.4 and above and iOS 5 and above
Using GapDebug with Sencha
Because Sencha Cmd already has tight integration with Cordova and PhoneGap, Ext JS and Sencha Touch developers can immediately benefit from the superior tooling of GapDebug.
Using GapDebug, you can simultaneously debug multiple apps running on iOS and Android, and you can even debug iOS apps from Windows. Considering all of the HTML and CSS inspection, JavaScript debugging, and resource profiling capabilities, using GapDebug is a great choice when it comes to wrapping Sencha applications with PhoneGap or Cordova.
Summary
In most areas, GapDebug exceeds the capabilities of Weinre. While both GapDebug and Weinre applications require instrumenting to support debugging, GapDebug is not invasive and does not modify your application code. The GapDebug inspector tools are state of the art and function even when the device is offline. Lastly, GapDebug continues to be rapidly improved by the Genuitec team.
Download GapDebug for free and start debugging your Ext JS and Sencha Touch applications today.

We’re excited to announce the official release of Rapid Ext JS 1.0, a revolutionary low-code…
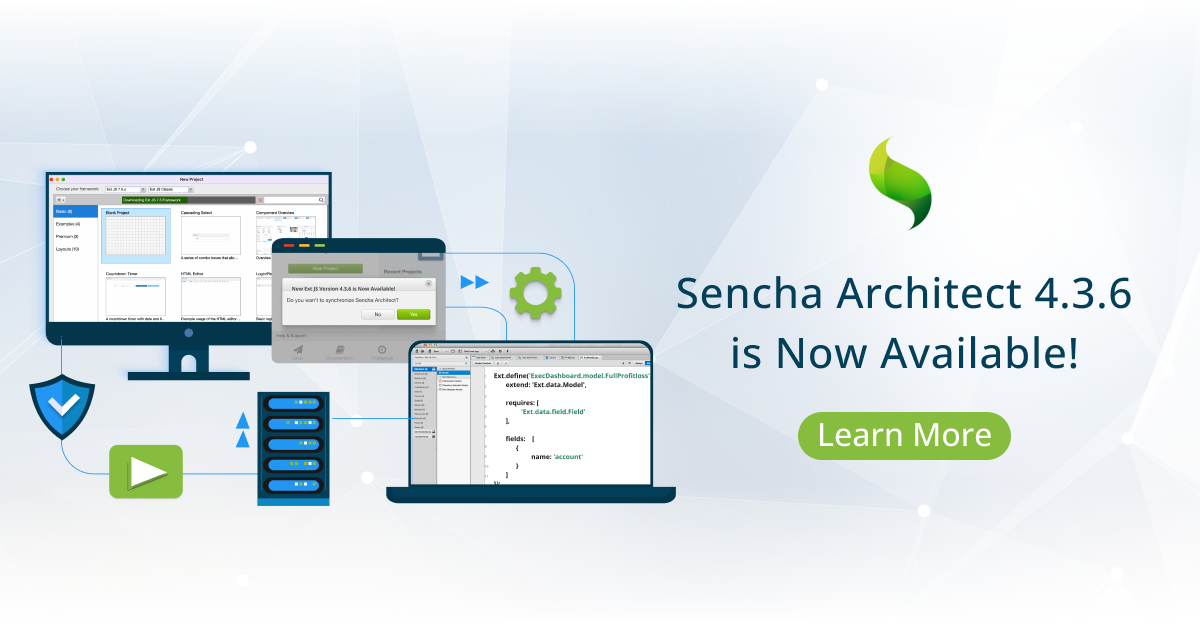
The Sencha team is pleased to announce the availability of Sencha Architect version 4.3.6. Building…

Sencha, a leader in JavaScript developer tools for building cross-platform and enterprise web applications, is…


