Sencha Inspector – 5 Productivity Features
With the GA release of Sencha Inspector, we have delivered a powerful new tool that can save hours of development and debugging time.
Let’s explore five features of Inspector that will improve your team’s productivity.
1. Identifying Over-Nested Layouts
Using over-nested layouts is perhaps the most common mistake that Sencha developers make – a practice that widely contributes to performance issues and display bugs. Unfortunately, over-nested layouts can also be difficult to find in complex applications.
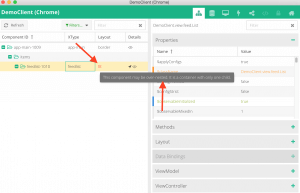
When viewing the component tree in Inspector, you will sometimes notice the layout type is highlighted in red text. This indicates that Inspector has found a potential problem with this component’s layout; hover over the red text to see more information.
2. Debugging Data Bindings
ViewModels and data binding were among the new features added to Ext JS 5. Although these features have reduced application code complexity, they can be very tricky to debug.
For example, where do you look when values bound to a component do not function properly?
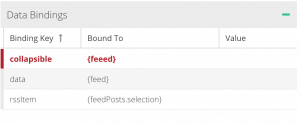
Inspector will analyze the data bindings on selected components, and highlight keys whose bound values are not found. In the example above, you may notice that “feeed” is misspelled – a simple error that might be very difficult to notice in a large codebase.
3. Exploring Application Architecture
Another area that commonly annoys developers is simply detecting whether or not a class exists in the application. This can be especially true when you have forgotten to run sencha app refresh after adding a new class to your project.
The “App Architecture” tab in Inspector allows you to quickly filter the list of all classes detected in the application. This may often be preferable to manually searching your browser’s developer tools to see if a specific file has been loaded.
4. Live Theming
Inspector empowers you to preview theming changes on-the-fly. With the introduction of Fashion, Ext JS 6 themes are more powerful than ever – but often developers don’t want to waste time hunting through a mountain of Sass variables just to experiment with basic changes.
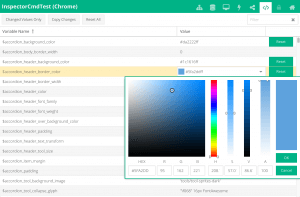
Simply follow the Live Theming guide to connect your application to Inspector. You’ll unlock the “Theme” tab, giving you the power to change every Sass variable, and preview the changes instantly in your browser. Inspector will even save the changes for you.
5. Direct Links to API Docs
Most Sencha developers would agree that our documentation is incredibly robust – a good thing considering the sheer number of configuration properties, methods, and events available on every class in the framework. Inspector now makes it even easier to find the documentation for components in your application.
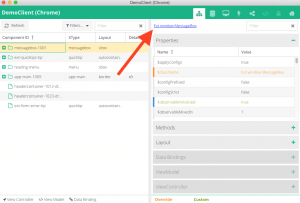
When viewing a component’s details, the right-hand pane contains a link to the documentation for known Ext JS components. Click this link to open the selected components’ API documentation directly in your browser.
Get Started Today
Inspector is available as part of Ext JS Premium package. You can try the evaluation version of the tool by downloading it as part of the Ext JS trial. You’ll get access to all five of these great productivity features – plus many more.

We’re excited to announce the official release of Rapid Ext JS 1.0, a revolutionary low-code…
The Sencha team is pleased to announce the availability of Sencha Architect version 4.3.6. Building…

Sencha, a leader in JavaScript developer tools for building cross-platform and enterprise web applications, is…


