How to Quickly Customize Ext JS Data Grid (Part 2/6)
In the first blog of this 6-part “Ext JS Grid Customization” blog series, we saw a few different ways to use built-in grid and column properties to customize a data grid. This blog demonstrates the use of built-in data display methods to quickly customize your data grid.
The example grid used here displays NBA 2020 player ratings.
This blog demonstrates grid customization using ‘Grouping Methods’.
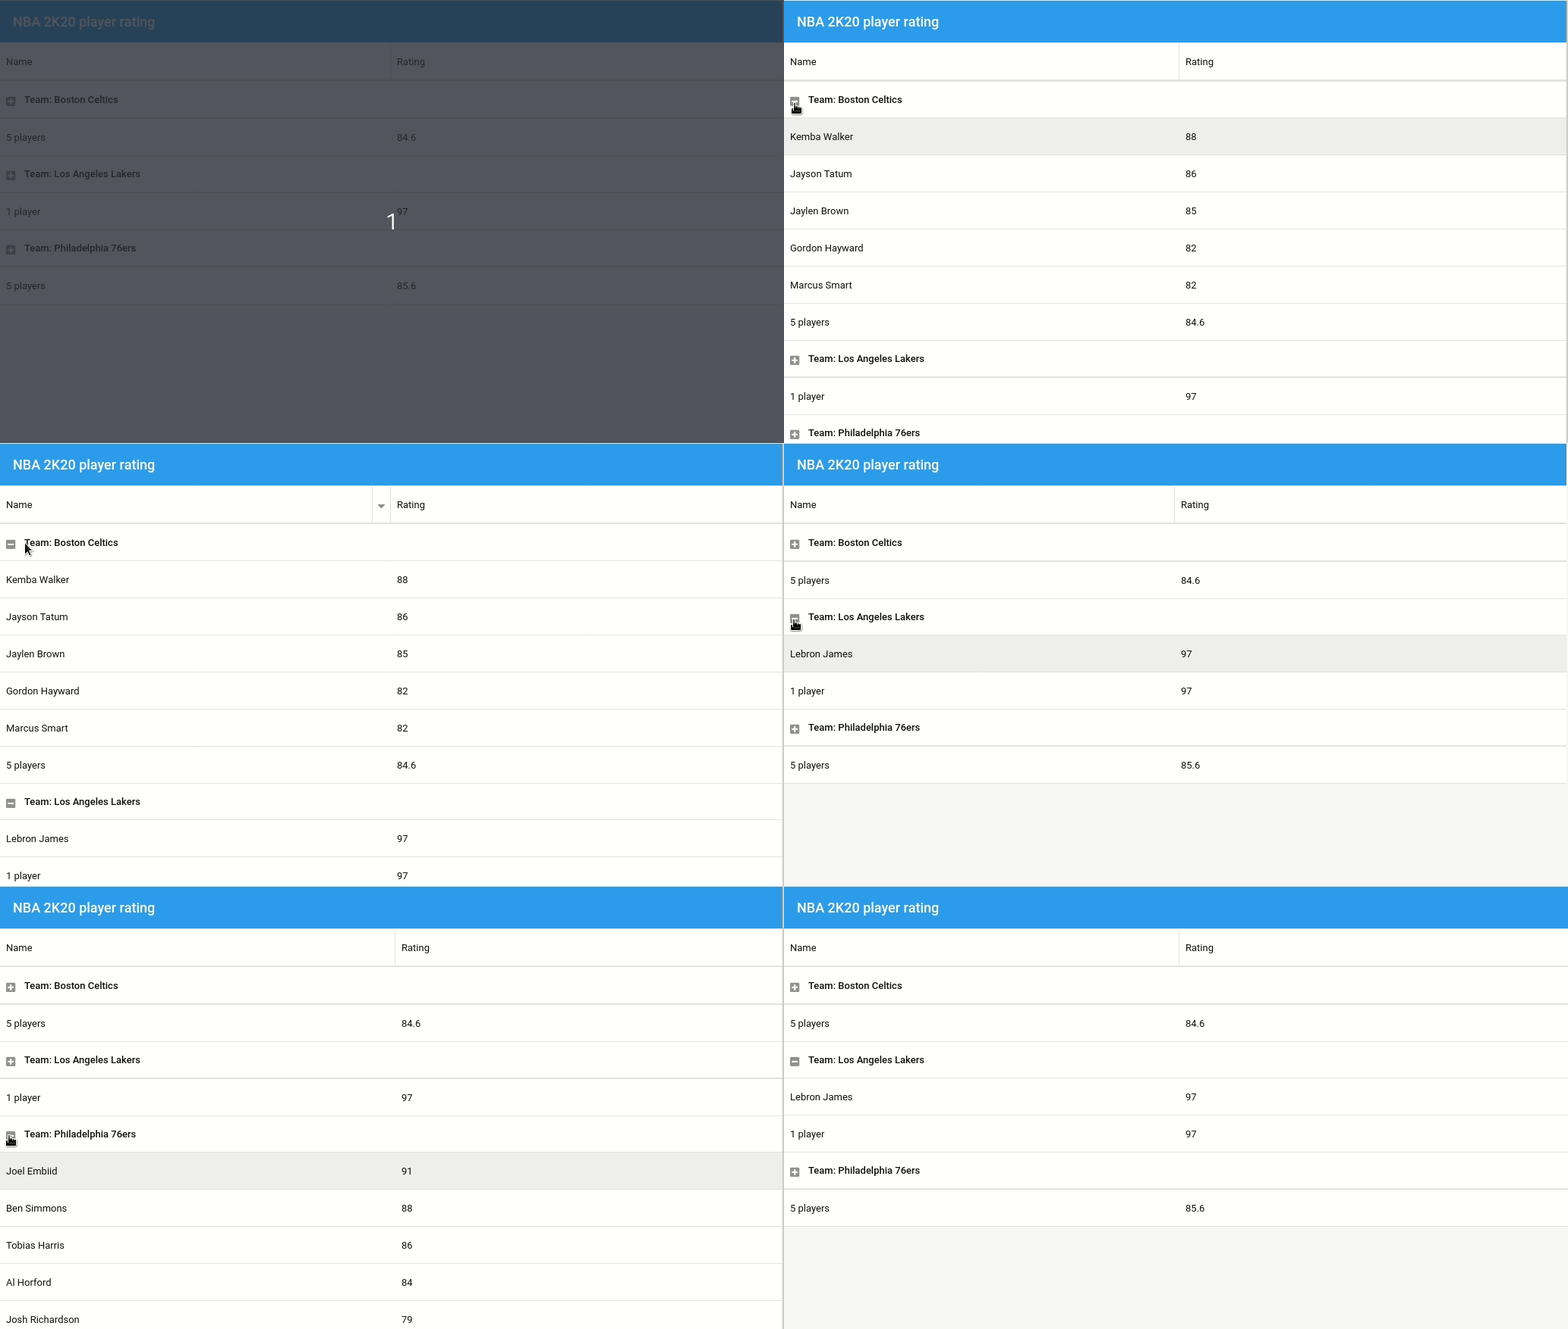
Grouped Grid
A grouped grid provides useful views of the row/column data by enabling data aggregation into groups.

Here’s the code that enables the feature:
1. Activate feature in grid configuration:
ftype: ‘grouping’
}],
2. Define group field in store configuration:
model: ‘Player’,
//Define group field
groupField: ‘team’,
data: [/* … */]
},
3. Customize grid (customize header or/and add summary row)
ftype: ‘grouping’,
//Customize group header
groupHeaderTpl: ‘Team: {name}’,
//Show summary row
showSummaryRow: true
}],
columns: [{
dataIndex: ‘player’,
flex: 1,
text: ‘Name’,
//Add a summary row
summaryType: ‘count’,
//Customize summary display
summaryRenderer: function (value) {
return Ext.String.format(‘{0} player{1}’, value, value !== 1 ? ‘s’ : ”);
}
}, {
dataIndex: ‘rating’,
text: ‘Rating’,
//Add a summary row
summaryType: ‘average’,
flex: 1
}]
Explore the code in the Fiddle Tool:
Grouped Grid Header
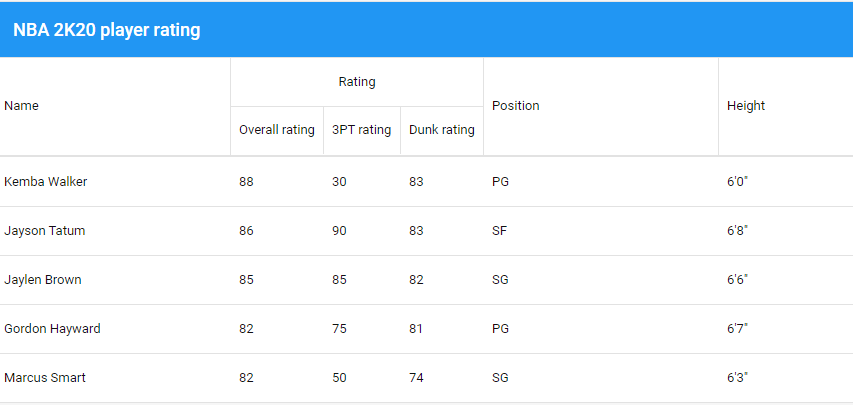
Users can customize header display by using grouped grid header

Here’s the code that groups the column display header:
dataIndex: ‘player’,
flex: 1,
text: ‘Name’,
},{
text: ‘Rating’,
columns: [{
dataIndex: ‘rating’,
text: ‘Overall rating’,
flex: 1
},{
dataIndex: ‘threePointRating’,
text: ‘3PT rating’,
flex: 1
},{
dataIndex: ‘dunkRating’,
text: ‘Dunk rating’,
flex: 1
}]
}, {
dataIndex: ‘position’,
text: ‘Position’,
flex: 1
},{
dataIndex: ‘ht’,
text: ‘Height’,
flex: 1
}]
Explore the code in the Fiddle Tool:
Stay tuned for our next blog covering “Row Editing” methods to customize grids.
Build Your Data Grid with Ext JS 7.1
The free 30-day trial of Ext JS 7.1 provides full access to the product features. Get started today and see how you can build a high-performing data grid for your application.

We’re excited to announce the official release of Rapid Ext JS 1.0, a revolutionary low-code…

The Sencha team is pleased to announce the availability of Sencha Architect version 4.3.6. Building…

Sencha, a leader in JavaScript developer tools for building cross-platform and enterprise web applications, is…


