Rapid Ext JS


New Charting Package for Sencha Touch
September 12, 2012
185 Views
 The upcoming release of Sencha Touch 2.1 will include our next generation data visualization system, featuring a newly revamped Charts package. This system is built around a new core graphics engine and supports several critical features exclusively in Sencha Touch. Such features include the modifier system, instancing rendering, segment-tree-based aggregation and much more. This article is a summary of some of the exciting innovations you can expect in Charts for Sencha Touch 2.1. Sencha Touch 2.1 and Charts are currently in beta. Please visit the Sencha Touch forum and watch for the announcement posts to get information about the beta and how you can participate.
Design Goals
We’ve taken a close look at your feedback for Charts, and we’ve worked hard to make Charts fit your needs even better. Here are two pain points we help you solve with Charts for Sencha Touch 2.1:
Performance: This release makes it possible for large data sets to be displayed smoothly on modern touch devices. Many of our customers were using Charts to display financial or time domain data which is often built with thousands of data points. We introduced the new model of rendering among a lot of other optimizations to make this happen. In an experimentation, we managed to display an 1,000,000-data line chart on iPad 2 device without any lag.
Flexibility: The previous incarnation of Charts could be difficult to extend. Writing a new type of series would likely mean creating one from scratch. With this new version of Charts, we have greatly improved object hierarchy and extensibility. Using this, you can easily customize your own types of series. For example, the 3D bar series demo in the Kitchen Sink was created to show just how easy it is to create a new type of series (check it out in the Beta build). This custom series was completed by an engineer in about an hour.
What’s New in the Draw Package
Extensible Sprites
Each sprite now has its own class. This change creates many benefits for performance, flexibility and maintainability. Drawing instructions will be defined directly in the concrete sprite classes. Subclassing a sprite allows users to enhance features of a previously completed sprite and conserve effort by sharing common functionality. In addition, taking advantage of the class hierarchy allows the draw engine code to be more modular and maintainable.
Modifiers and Attribute Definitions
Modifiers and Attribute Definitions are the two most innovative notions introduced in this chart release.
The Attributes Definitions (AD) lets users define custom attributes onto custom sprite classes to perform lazy updates. Each sprite will have a member called “attr”, which is the “attribute set” of the sprite. All states—as well as caches—need to be stored in the attribute set. The primary purpose of AD is to define how data should be used to change the content of an attribute set when setAttributes is called.
AD can define appliers (called processors) and updaters like the config system in Sencha Touch. But in order to achieve greater performance, update processes are batched. For example, when you change the width and height of a rectangle sprite, in the both cases you need to update its path cache. We batch the updating so the path will be updated only once.
Appliers of AD, called “processors” in this context, allow the user to check and normalize the value before it is applied to the attribute set. Names can be used to refer to predefined processors. This is very convenient and vastly enhances maintainability. AD also allows users to define aliases to the attribute items.
Modifiers empower a user to make additive changes to an attribute set. A modifier is an adaptation of the Decorator pattern. A sprite can have a list of modifiers that chain together to process the content of an attribute set. In this way, a modifier is like a pipeline of filters that build up the resulting attributes progressively. For instance, when we query the value of an attribute set, the highlight modifier will change certain attributes to be its highlighted value; similarly, the animation modifier will generate the current value for each animated attribute for each frame.
Modifiers work independently that increases maintainability by making each modification modular. Previously, highlighting a sprite involved working with animation inside the highlighting code. This would involve about 60 lines of potentially error prone code. With modifiers, highlighting happens in two lines (simply set the highlighted attributes), and the sprites will highlight without any surprise.
Flyweight Instancing Sprite
In the new Chart Package, we represent a lot of visual elements of a Chart as “markers”. Markers are flyweight sprites forked from a single attribute set JavaScript prototype, and these markers share the same sprite object. In such a way, a sprite defines the logic to render—not the data. Duplicating sprites is a heavyweight operation and can be computationally expensive. Instead, only the incremental data for rendering is created for a set of objects that differ slightly. This saves a very significant amount of memory. This technique is often referred as “instancing rendering”. In the new Draw package, an instancing sprite is a container of the forked instances and renders them using instancing rendering.
Retina Display Support
The draw package now detects Retina pixel-doubled displays using the HTML5 API window.devicePixelRatio and will increase the pixel rate for better fidelity on high resolution devices. Charts that need pixel alignment will also take this factor into account. Unless the device pixel size is requested, the pixel ratio will be invisible to developers as the draw engine continues to be vector-based.
What’s New in the Chart Package
Aggregative Charts
When we try to plot a huge data set directly on the screen, we are possibly plotting hundreds of points within a space of less than a pixel. This will be a huge waste of calculation power considering the cost of algorithms for stroking and filling. Therefore we only keep the minimum and maximum value within one pixel (by width). For example, if a very large data set has 1000 data points that would render to a pixel in width (such as a financial chart), the chart will only render the minimum and maximum value of that data set within that pixel. We achieve this summarization by a preprocessing technique called “aggregation”. By aggregation, we can query the desired simplified data to a given specificity instantly.
To solve this problem, we used a Segment Tree, which is a data structure for swift data aggregation. It requires linear time and space to finish the aggregation and logarithmic time to query; it also allows record updating in O(log(n)) time.
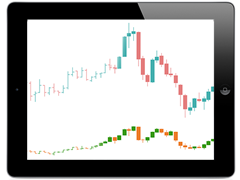
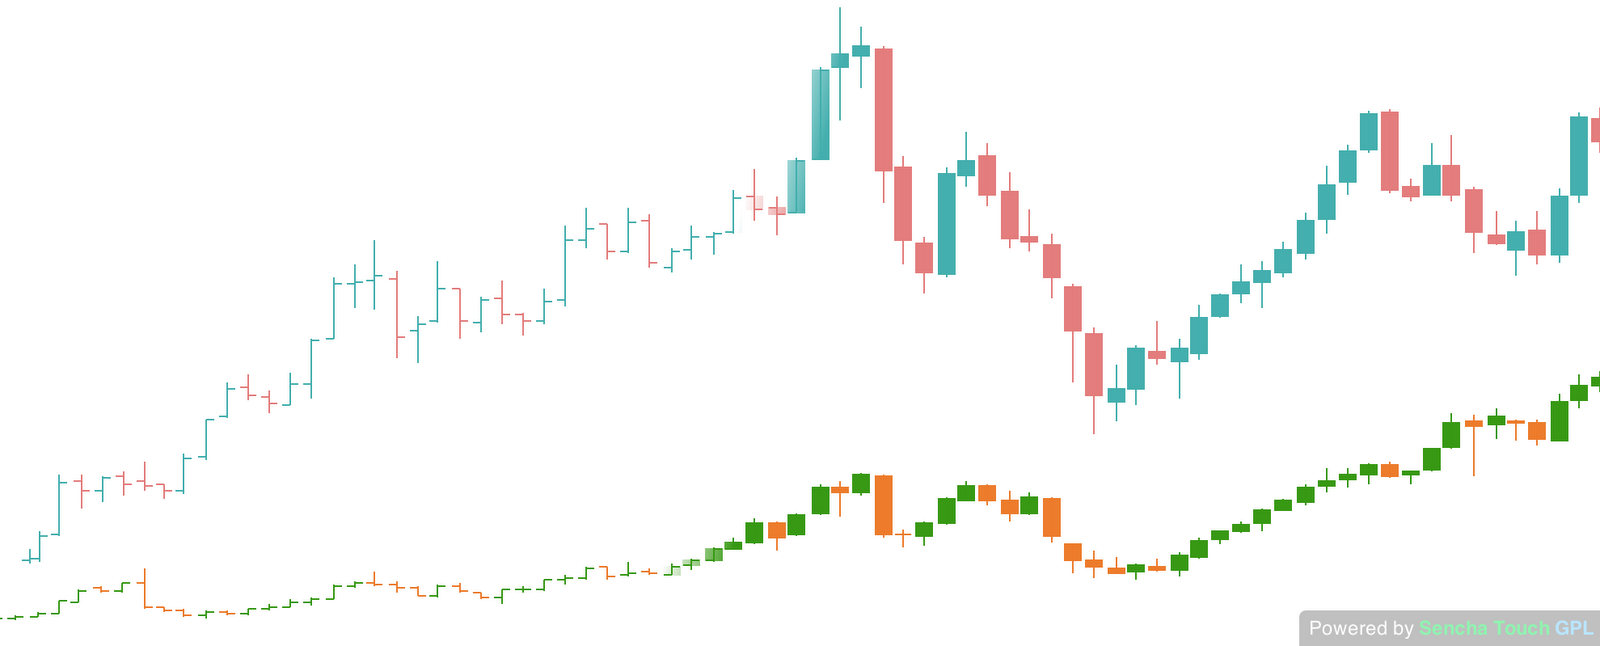
Financial Chart Types
To display financial data using the Chart package, we are introducing two new charts: the Candlestick chart and the Open-High-Low-Close (OHLC) chart. These are both available as the candlestick series in the new Charts package.
Conclusion
We’ve been hard at work making Charts for Sencha Touch 2.1 a major leap forward in data visualization on mobile. With a reworked underlying drawing system and huge performance improvements, we think the new Charts package will make it easy for you to bring rich and interactive graphics to your mobile web apps. Sencha Touch 2.1 is currently in beta, and we look forward to hearing your feedback to see how you use Charts in your applications.
Did you find the content helpful?
 0
0

 0
0

Latest Content

Ext JS 7.8 Has Arrived!
The Sencha team is pleased to announce the latest Ext JS version 7.8 release. Following…
May 13, 2024

React Apps Development Using ReExt with Ext JS Components
The world is moving fast towards online businesses. Businesses are established online via social media,…
May 1, 2024

How to Write Unit Tests with Sencha Test
In modern software development, unit testing has become an essential practice to ensure the quality…
April 19, 2024