Using Ext JS to Visualize and Interact with IoT Data
September 20, 2016
238 Views
In today’s modern world, we’re seeing an increasing number of Internet-enabled devices; a movement referred to as the Internet of Things (IoT).
Consumer devices such as fridges, lights, alarms, door locks, and coffee machines are all being connected to the Internet, using a variety of communication methods. Add on top of that the range of enterprise-type devices, from smart street lighting, security systems, various types of field sensors, health monitoring devices, and more, it’s easy to see how pervasive IoT devices are becoming.
This Internet enablement of devices presents a potential problem though: in an enterprise environment, businesses more frequently have to aggregate, visualize, and interact with a variety of different data sources using a dashboard.
Luckily, a lot of these types of devices feature RESTful-based APIs, enabling us to hook up a web front-end to them.
Ext JS is perfect for this type of rich front-end; the framework features a large suite of out-of-the-box components and is able to summarize data from various sources using Ajax and RESTful calls, and present information using dashboard-like widgets.
PubNub: Real-time Messaging Service
To aggregate and push all of this constantly updating data to the browser would normally require a fair amount of back-end work, unless we use a real-time messaging service such as PubNub.
PubNub provides 70+ different platform SDKs, enabling a large number of Internet-enabled devices to communicate with each other over the PubNub service. Regardless of platform being used on each device, it helps aggregate the messaging of these devices and systems over a standard service.
As an example, for a Node.js enabled sensor device, it’s possible to publish sensor data from the device to PubNub like so, using the PubNub Node.js SDK:
var pubnub = require('pubnub')({
   ssl: true,
   publish_key: 'publish-key-here'
});

pubnub.publish({
   channel: 'mychannel',
   message: {
       sensor: 'temperature',
       value: sensor.getValue()
   },
   callback: function(e) {
       console.log('Message sent', e);
   }
});
Then, in a front-end web app, it’s possible to leverage the PubNub JavaScript SDK to subscribe to messages on the same channel name, in order to use it in the web app:
PUBNUB.init({
   ssl: true,
   subscribe_key: 'subscribe-key-here'
}).subscribe({
   channel: 'mychannel',
   message: function(message) {
       console.log(message);
   }
});
The above example will yield an object that looks something like this in the browser’s Console:
{
   sensor: 'temperature',
   value: 32.2
}
PubNub also provides a collection of real-time data stream examples, where you can use sample data in the absence of having real IoT devices to experiment with.
One of these data streams is the simulated Sensor Network that provides data from sample devices, including photo, temperature, radiation, and humidity sensors.
The sample data is received in an object that looks like this, which can be easily consumed by an Ext JS app:
{
   "photosensor":"809.09",
   "ambient_temperature":"23.10",
   "radiation_level":"203",
   "humidity":"87.8553",
   "timestamp":1469761686,
   "sensor_uuid":"probe-019eda76"
}
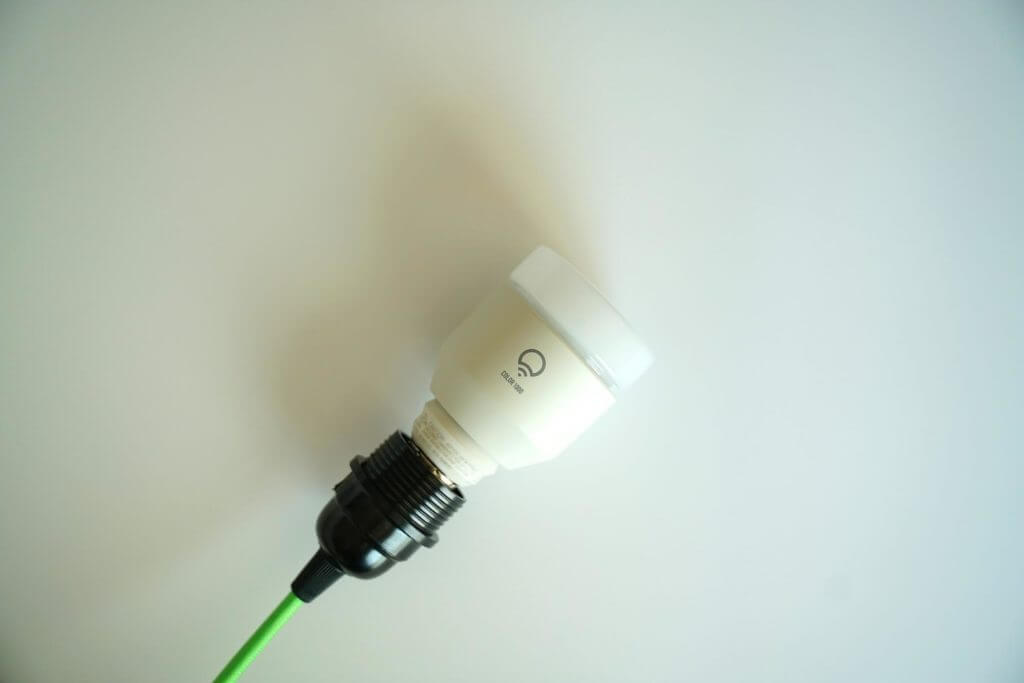
LIFX: Internet-Connected Light Bulb
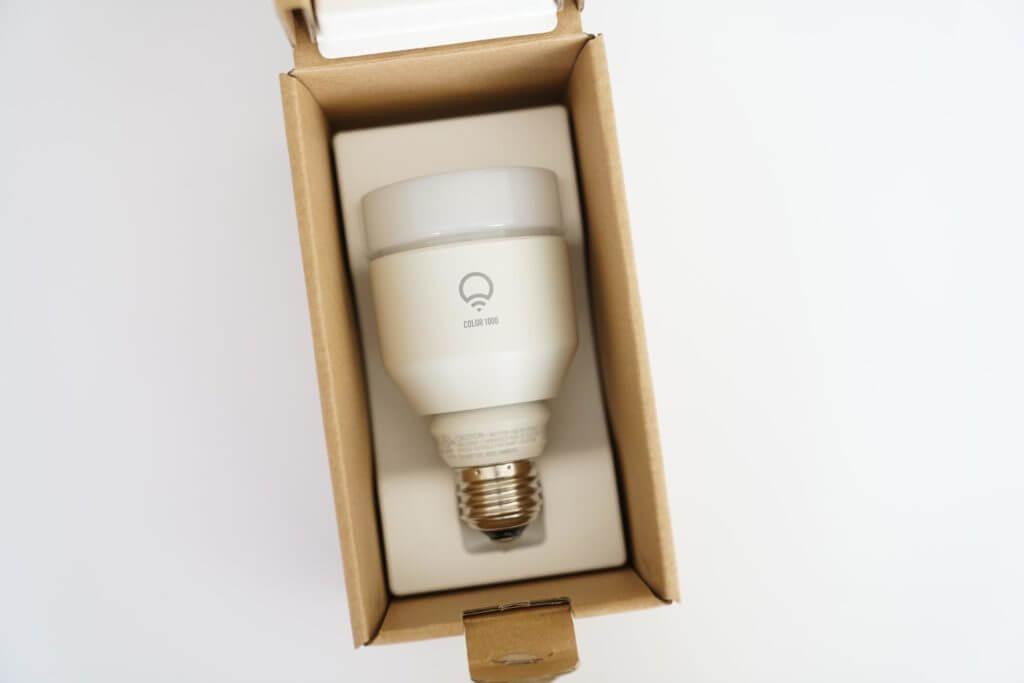
One of the interesting IoT devices on the market has been created by LIFX, a company that manufacturers internet-connected light bulbs. Using the RESTful API provided by LIFX, it’s possible to issue calls to one or more LIFX light bulbs you own.
In order to make a RESTful call to the LIFX API, we have to reference a specific URL (https://api.lifx.com/v1/), along with an endpoint based on the action we want to take (e.g. /lights/all/effects/pulse to flash bulbs, or /lights/all/state to set the on/off state of bulbs). The method of the request (GET, PUT, or POST) will also vary based on the endpoint. Lastly, we need to provide an Authorization header in the request which provides the LIFX API with an authorization token.
Through a custom Ext JS class, we’re able to create a wrapper class that makes it easy to interact with a LIFX Internet-connected light bulb from within an app, rather than manually making RESTful Ajax calls directly.
A custom class would start by looking something like this, where we specify a base URL, and an authorization token (normally you would store this type of token on the server-side, but for demo purposes we’re including it in the client app):
Ext.define('Dashboard.ux.data.Lifx', {
   singleton: true,

   requires: [
       'Ext.Ajax'
   ],

   url: 'https://api.lifx.com/v1/lights/all',

   token: 'd195411c0d274c69c4ea43a8972100000000709822'
});
We then add methods to this singleton class as required, which will perform the various actions made available to us by the LIFX REST API, such as pulsing (flashing) bulbs and setting the state (on/off):
Ext.define('Dashboard.ux.data.Lifx', {
   singleton: true,

   requires: [
       'Ext.Ajax'
   ],

   url: 'https://api.lifx.com/v1/lights/all',

   token: 'd195411c0d274c69c4ea43a8972100000000709822',

   pulse: function(config) {
       var me = this,
           data;

       data = {
           power_on: true,
           from_color: 'white',
           color: config.color,
           period: config.period,
           cycles: config.cycles,
           persist: false
       };

       me.sendRequest('/effects/pulse', 'POST', data);
   },

   setState: function(config) {
       var me = this,
           data;

       data = {
           power: config.state,
           color: config.color,
           brightness: 1,
           duration: 0
       };

       me.sendRequest('/state', 'PUT', data);
   },

   privates: {
       sendRequest: function(endpoint, method, data) {
           var me = this;

           Ext.Ajax.request({
               url: me.url + endpoint,
               cors: true,
               method: method,
               jsonData: data,

               headers: {
                   'Authorization': 'Bearer ' + me.token
               }
           });
       }
   }
});
Then, in an Ext JS app, we could easily flash the light bulb red 120 times, with each flash lasting half a second:
Dashboard.ux.data.Lifx.pulse({
   color: 'red',
   period: 0.5,
   cycles: 120
});
Or, we can just turn off the bulb like this:
Dashboard.ux.data.Lifx.setState({
   state: 'off'
});
Having this type of utility class is much cleaner than making Ajax calls inline throughout the app, to turn bulbs on and off; instead, all communication can be managed by this central singleton class. Similar helper classes could be added in the future for other devices we may want to access and control.
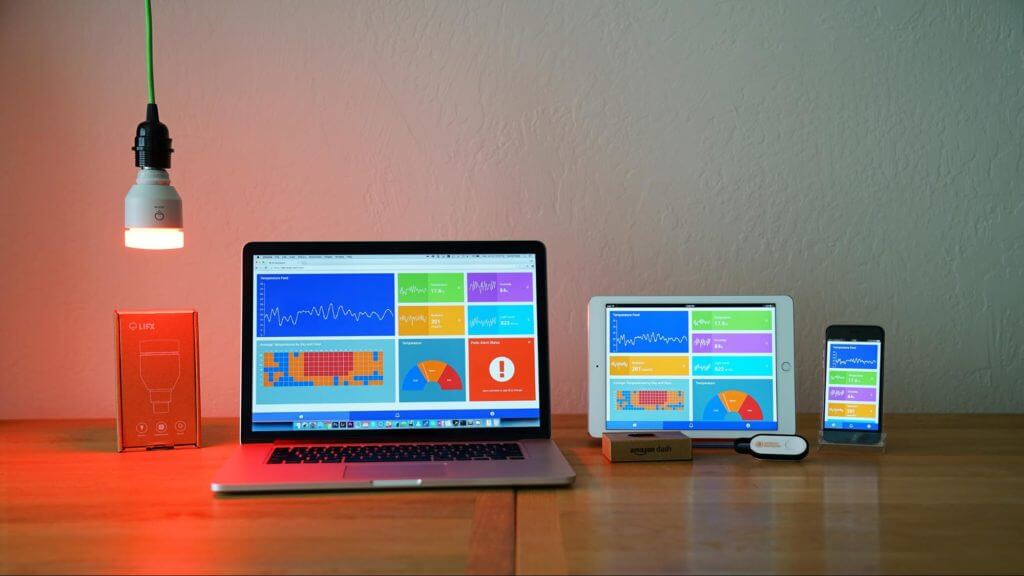
Dashboard App
By using the simulated Sensor Network data stream provided by PubNub, it’s possible to build an Ext JS dashboard app that visualizes these sensor values and shows an alert if a value exceeds a pre-defined threshold, for example if the temperature sensor exceeded 35℃ / 95℉.
The dashboard app could also signal to a LIFX light bulb to flash red, when one of the sensors exceeds its defined threshold, rather than just showing a simple alert on-screen.
An IoT Dashboard App Built Using Ext JS 6.2
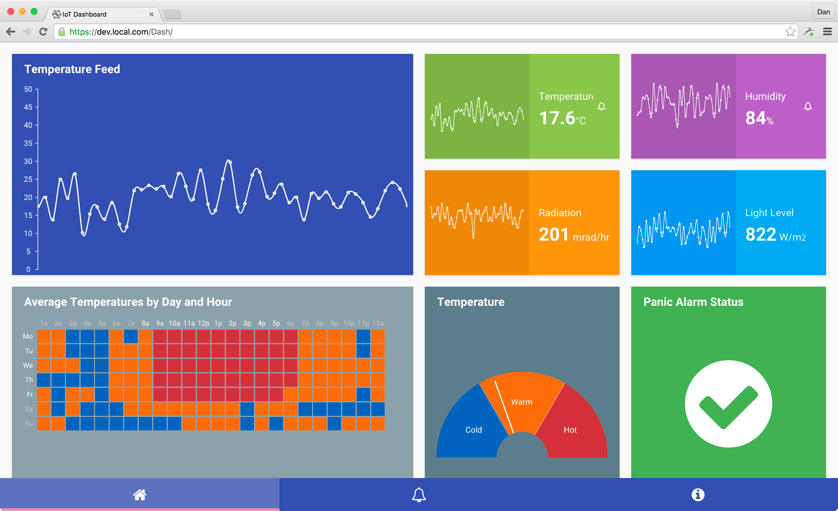
If we take one of the dashboard panels, we can highlight how it has been constructed:
For this particular dashboard panel, we have a Container configured with an HBox layout, inside which we have two components aligned side-by-side. The left-hand component is an Ext JS cartesian chart, with its axes and labels hidden, and the right-hand component is a Panel with a template that is bound to a specific sensor.
At the application level, the PubNub API is being used to stream sensor data. When new data is received, the sensor values are being pushed into a Store, to which the various charts are bound, and they are configured to show only the most recent fifty data points.
If the received sensor value is above the maximum threshold (defined via a custom maxValue config on the panel), the app will flash the LIFX bulb orange a couple of times:
Dashboard.ux.data.Lifx.pulse({
   color: 'orange',
   period: 1,
   cycles: 2
});
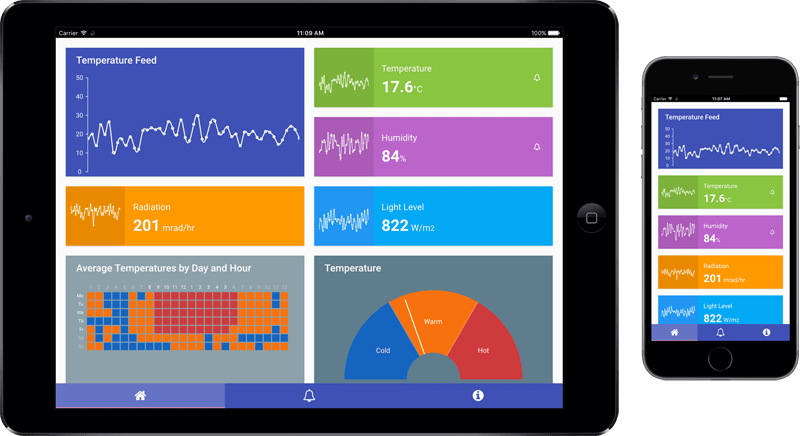
By leveraging the platformConfig on the dashboard panels, we’re able to tailor the height of each panel based on the device type, for example:
{
   platformConfig: {
       phone: {
           height: 100
       },
       tablet: {
           height: 120
       },
       desktop: {
           height: 180
       }
   }
}
Widths can be controlled through Sass/CSS, where we use screen size media queries to define which CSS variables are used:
$dashboard-item-spacing: 20px;

@media (min-width: 720px) {
 .medium-50 {
   width: calc(50% - #{$dashboard-item-spacing});
 }
 .medium-25 {
   width: calc(25% - #{$dashboard-item-spacing});
 }
}

@media (min-width: 1048px) {
 .big-50 {
   width: calc(50% - #{$dashboard-item-spacing});
 }
 .big-25 {
   width: calc(25% - #{$dashboard-item-spacing});
 }
}
These customizations show the various ways in which the dashboard panels can be appropriately sized for use across smartphones, tablets, and desktops, all from one common codebase.
Conclusion
The Internet of Things is getting bigger and gaining more traction in the enterprise, meaning there’s more data from more sources. In order to do anything meaningful with that data, we need a way to analyze and summarize it. Ext JS enables developers to produce a very rich dashboard that presents this data from IoT devices, and interacts with and controls them based on results of the data. Using a complete framework like Ext JS also provides the benefit of not having to mix and match components from various different vendors. Instead, everything is provided for you out of the box with Ext JS.
To learn more about the growing IoT movement, how to build an Ext JS dashboard, and interact with IoT devices, be sure to attend my session at SenchaCon 2016, which is taking place November 7-9 in Las Vegas:
An Ext JS Dashboard for Visualizing and Interacting with IoT Data
Big data and Internet of Things (IoT) connectivity is increasingly forcing enterprises to find solutions to organize and visualize large amounts of incoming data. To allow for rapid decision-making, for everything from immediate actions in tactical situations to strategic analysis and reporting, developers need the ability to provide a flexible dashboard that can visualize critical insights from all that data, on any screen and device. This session will demonstrate a dashboard app that provides big data analysis capabilities and interacts with IoT devices via Ext JS constructed components including Grids, Charts, and Widgets.
Did you find the content helpful?
 0
0

 0
0

Latest Content

Introducing Rapid Ext JS: The Ultimate Low-Code Editor for Ext JS Development
We’re excited to announce the official release of Rapid Ext JS 1.0, a revolutionary low-code…
August 21, 2024
Sencha Architect 4.3.6 Has Arrived!
The Sencha team is pleased to announce the availability of Sencha Architect version 4.3.6. Building…
August 20, 2024

Introducing ReExt: A Game-Changer for React Developers
Sencha, a leader in JavaScript developer tools for building cross-platform and enterprise web applications, is…
August 20, 2024